Dune Digest #81
Ethereum, Solana, MEV, Tether & MORE!

GM
Welcome to issue #81 of Dune Digest!
We have some cool data for you today. Firstly though, a reminder to all Wizards and Wizard teams.
Migration, migration, migration
One month ago, we launched our new plans.
The new plans = the new Dune.
They give you much more value, features, and power. Hundreds of Wizards have already migrated to the new plans, and are getting:
API access
Flexible performance tiers
Unlimited team collaboration
Cutting edge features
For example, we recently released scheduled queries.

Now you can schedule them to refresh at any time interval you choose, keeping them fresh on autopilot!
But, you can only make use of it with credits on a new plan. The same goes for exciting new features we have in the pipeline like materialized views.
So, want to make the most of Dune?
Migrating takes 2 minutes. All you need to do is select the plan you want, add your teammates, and start using Dune to its full power.
Switch to a new plan today!
Now let’s get into this week’s data!
Ethereum Nuggets
A recent dashboard by the incredible @21shares has some really interesting little nuggets on Ethereum, which they shared today in a Twitter thread.
Let’s look into the highlights.
Firstly, as assets mature their price volatility tends to decrease. Indeed, we can see this with Ethereum. As the price has risen since 2016, it has fluctuated in a tighter range.
Though still volatile, it is on the road to maturity.
@21shares note in their thread that:
“Some tech stocks like PTON (95%) and TSLA (65%) even have higher volatility than ETH”

The second interesting metric to note is Ethereum’s monetary policy. We can see that since The Merge, this has changed drastically - with Ethereum becoming highly deflationary over the past several months:

While Ethereum has been tinkering with its monetary policy and its consensus mechanism, it has cemented its role as a key settlement layer of the crypto world.
It was in April of 2021 that Ethereum first processed $1 trillion in monthly volume.
Since then Trillion plus months have become the norm:

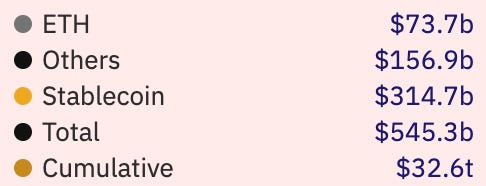
In April alone, Ethereum settled over $314 Billion in stablecoins, over $73 Billion in $ETH, and ~$157 billion more in ERC-20 and other tokens:
Another interesting metric to look at is gas spent, and how it was spent.
Back in the day, when Ethereum was still in its infancy, the majority of gas was spent on $ETH transfers, contract creation and other relatively simple tasks.
Over time we can see more and more gas being spent on more sophisticated uses like DEX trades, NFT mints and stablecoin transfers.

In recent weeks, we can see that a lot of gas is spent on DEX trades and NFT mints, with various trades and transfers also consuming significant amounts:

NFT mints and trades are using ~20% of gas, but a lot of that might be dubious activity.
According to the dashboard, wash trades have driven ~80% of total NFT trading volume in recent weeks:

Overall, Ethereum has been, is, and will be an exciting place. It settles a truly massive amount of economic value, and supports a vast ecosystem of different applications and communities.
This dashboard is full of gems, many of which we didn’t cover. You should check it out.
The State of Solana
Since launching in 2020, Solana has had a pretty wild and interesting history.
Six months ago many commentators were proclaiming the network dead - but that was premature. It is very much alive, and we can verify that through a new Solana dashboard by @cryptokoryo.
In Solana’s short history it has seen almost 33 billion transactions:

And over 21 million users…….
Transactions peaked in November 2021 with 1.5 billion throughout the month.
Monthly transactions dropped in 2022, but spiked again through the year as NFT and StepN drove usage to the network.
Since then we’ve seen further dips, but the network has kept humming along through the bear market, and has seen relatively steady usage.
May has seen over 700 million transactions in total:

When it comes to programs - smart contracts in Solana parlance - the pattern is a little different.
Active programs peaked one year later than transactions, and grew steadily through the bear market. In 2023 so far, this metric has held strong:

(note that this data point may include validator votes)
When we look at users, we see some interesting data.
Active users appear to peak a little over a year ago, then decline steadily through late 2022. Then we see a huge spike this month:

What’s the deal with that? It is hard to say, but we can note a few data points on Solana’s users and speculate about what they mean.
When we look at the average account balances, the result is startling. The vast majority - over 99% - hold less than .1 $SOL.
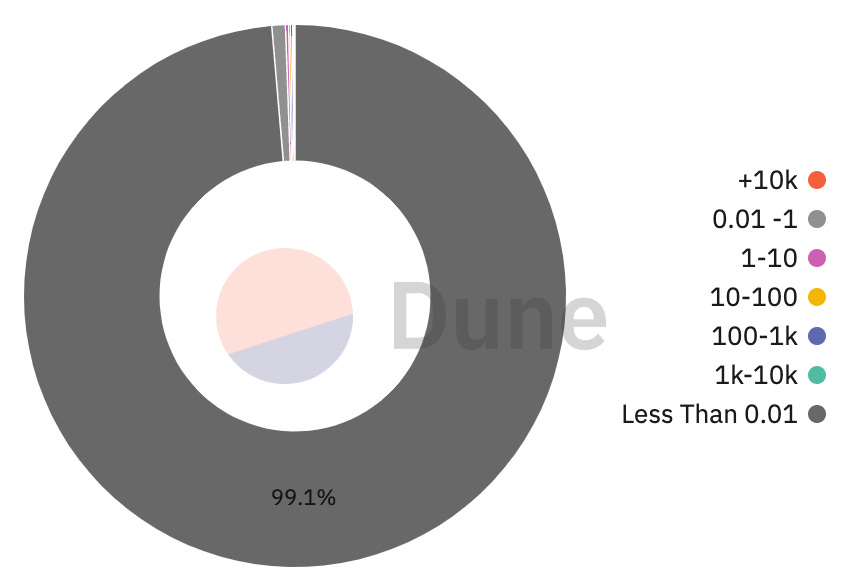
This suggests something odd going on.
We can also see that the amount of $SOL Whales, those holding more than $5 Million’s worth, have also dropped significantly.
Finally, the amount of DEX traders has dropped to <500k monthly since mid-2022 and shows no sign of recovery.
On the other hand, the DEX market itself seems to have become more diverse:

All in all, Solana seems to be struggling in some regards - but still doing relatively well considering the macro conditions.
That said, some metrics in this dashboard do pose some interesting questions in need of investigation by Solana focused Wizards.
Check out the full dashboard for much more.
The Evolution of MEV
We have not talked about MEV for a while in Dune Digest. That doesn’t mean that it isn’t still raging in the Ethereum ecosystem though.
Far from it in fact.
According to a new dashboard by the one and only @hildobby, by some metrics MEV is bigger than ever.
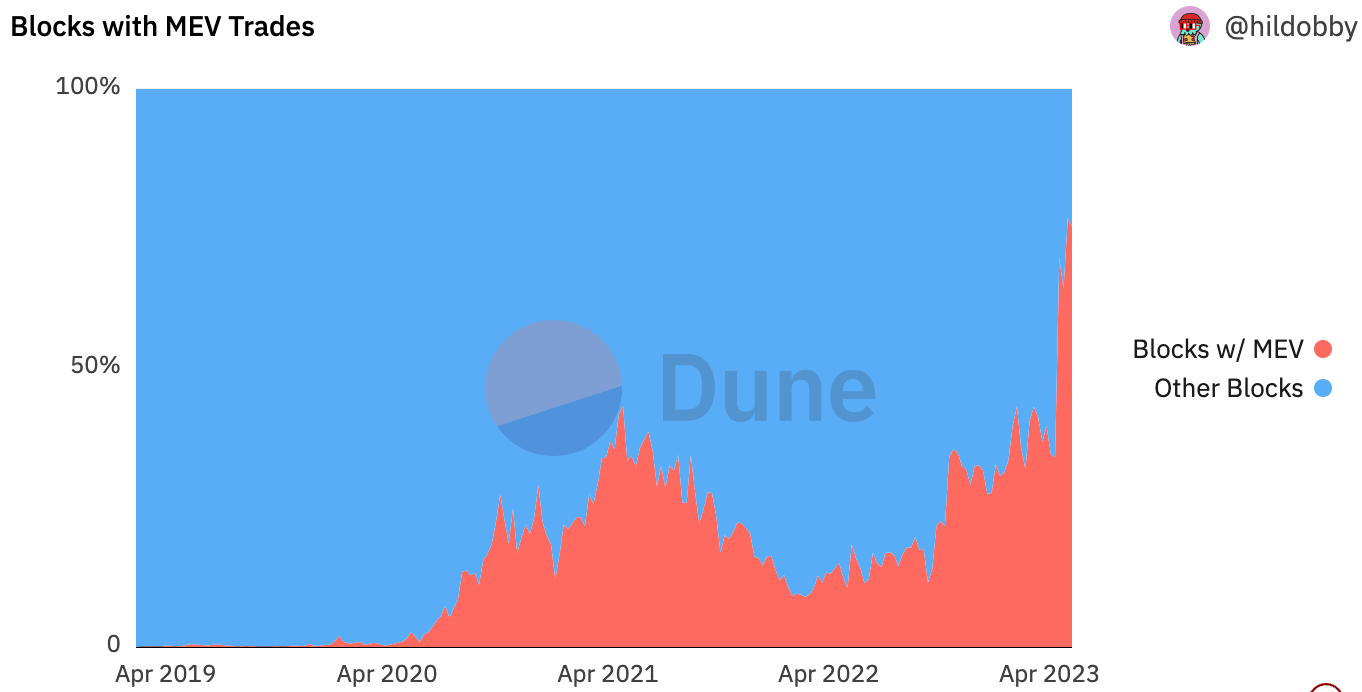
The dashboard focuses on “sandwich” attacks, which essentially involves executing two rapid swaps around a victim's trade, essentially buying before and selling after the victim's transaction to exploit price fluctuations.
The % of Ethereum blocks with sandwich attacks peaked in Q2 of 2021 at over 40%. Then it died down through 2022, before rising in 2023 and rocketing over the past several weeks.
In May, over 70% of blocks have contained sandwich attacks:
As you can imagine, this is due to a significant total increase in attacks.
Throughout May, they’ve been happening more than ever - with more than 100k sandwich attacks weekly:

At the same time, they’ve become more risky for the attacker.
Sandwich attacks do not always make money, far from it. Through much of 2021 and all of 2022, around ~90% of sandwich attacks were profitable.
Since the beginning of this year though, the % of profitable attacks fell to ~65%. Recently though this has climbed once again:

What is the cause of this epic rise of sandwich attacks?
The blame can be put on the emergence of a few sophisticated MEV bots.
One in particular, associated with an address labeled jaredfromsubway.eth, has been very active, making over $30 million in profits over the past few months.
This dubious character has made the majority of profits since the recent meme coin frenzy.
To learn more, check out the full dashboard.
USDT Money Printer
For a long time, Tether’s $USDT has been one of (if not the) most important stablecoins in crypto.
Tether has been making some moves lately, increasing its Treasury bill holdings and diversifying away from cash, traditionally its largest form of collateral.
What does the data tell us about the health of $USDT? A new dashboard by @stablecamel has some interesting nuggets, let’s check them out.
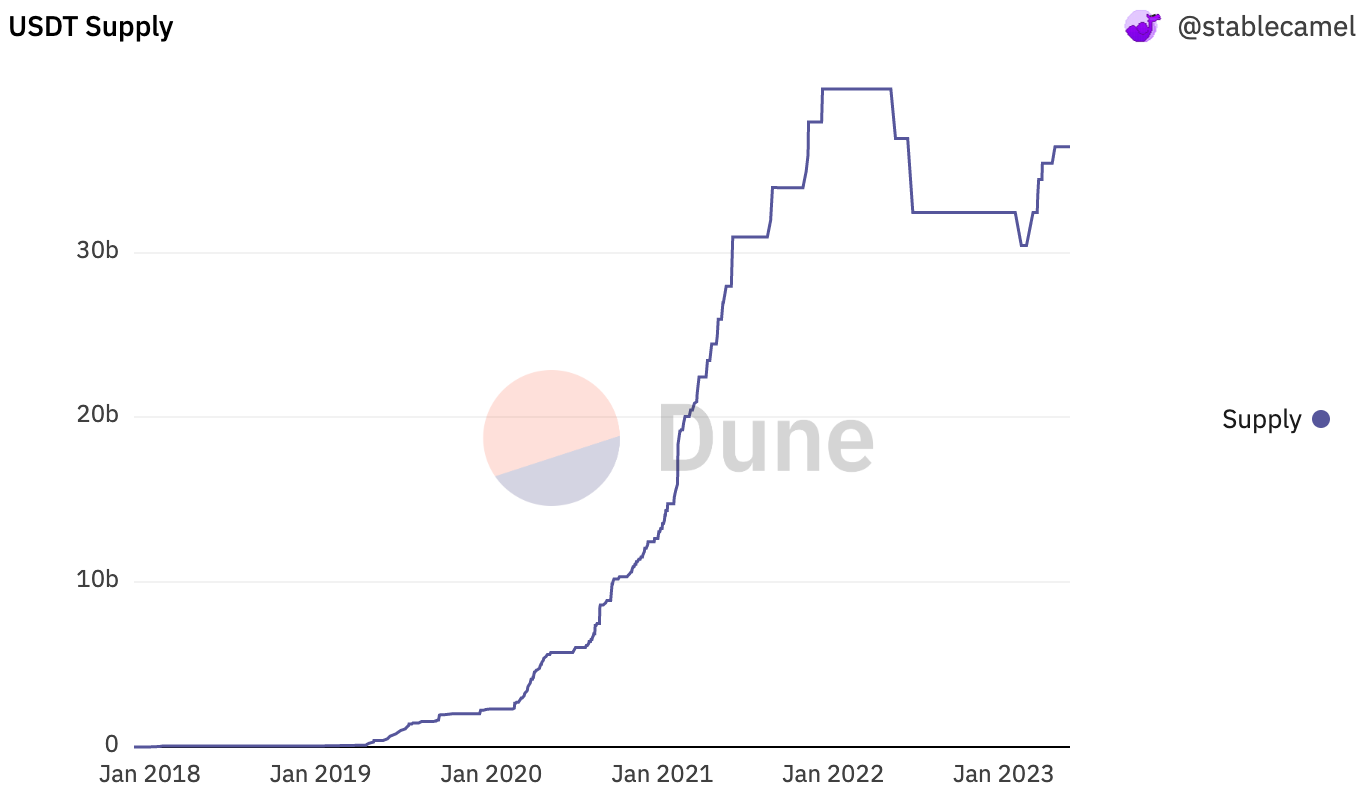
Firstly, $USDT’s supply (on Ethereum) peaked in Q2 of 2022 at almost ~$40 Billion before dropping throughout the rest of the year.
It has, however, been growing noticeably since mid February, and is nearing its all time high again.
Despite this growth, other metrics show a slowdown and contraction.
There is currently ~$723.1 million $USDT deployed to LP and lending pools.
This peaked at the beginning of 2022 at over $4 billion, but has been dropping steadily throughout the past year - currently lower than any time since early 2021:

Exchange balances are also down from their peak of over $8 Billion in September 2022.
These balances have dropped by ~25% since then, with much of the drop driven by draining Binance balances:

$USDT deployed to lenders like Aave, Compound, Iron Bank and others is also way down, although has seen a small bump in recent months:

Finally let’s look at the most dramatic of all, DEX balances.
$USDT on DEXes has dropped significantly - from over $3 Billion in early 2022 to <$500m today. The majority of this has been driven by liquidity being drained from Curve:

Overall, $USDT is way down from its peak stats at the height of the last bull market. This is not surprising though, and the token is still a key part of DeFi on Ethereum and beyond.
Check out the full dashboard for much more data.
Worldcoin Update
Sam Altman’s crypto project, Worldcoin, is back in the crypto news cycle.
This time it isn’t for ominous looking orbs, but rather a recent $115 million raise and the launch of its world.app wallet.
World App is covered by an interesting recent dashboard by @subinium. Let’s check it out.
The app is already getting a lot of usage, with 67.4k NFTs minted so far:

This reached a peak earlier in the month on the 15th:

This is still an emerging project, and we expect to see more and more dashboards covering Worldcoin in the near future.
Check out the full dashboard for more!
More Dashboards
GN
Thank you for reading and as always a special thanks to all the Wizards who contributed to this week’s edition.
Have a good weekend.
We’ll be back next week for more data, dashboards & Wizardry.
Nice
Nice info