Dune Digest #80
Lido Withdrawals, BNB, Uniswap users, DEX aggregators & More!
GM
Welcome to the issue #80 of Dune Digest.
We’ve got some crazy data for you this week. First though, a little Dune news.
DuneSQL Migration Update
We hit day 30 of our 90 day DuneSQL migration plan.
We’re excited to make DuneSQL the only query engine, and bring you powerful features like:
Queries as views
Query performance levels
Queries as materialized views
Scheduled queries
Bring your own data
And many more.
Right now we’re focused on 3 core objectives:
Supporting query migration
Improving DuneSQL’s stability + performance
Transitioning Spellbook to DuneSQL
We’ve had some great progress lately. To read a detailed update at the 1/3 mark - check out this new blog post.
Query Collaborators
We shipped an important feature this week - query collaborators.
Now for all queries with version history, you can see all the Wizards who contributed to it in the top right.
This is an important step to making sure every analyst on Dune receives proper credit for their work.
Now let’s get into this week’s data
stETH Withdrawals 💸
Lido is the king of liquid staking protocols with over $12 Billion in TVL, and currently represents 31% of all staked $ETH.
Despite the Shanghai upgrade in April, Lido only enabled withdrawals of $stETH when Lido V2 launched at the beginning of this week.
There was a lot of anticipation of this event, so what actually happened? A new dashboard from the amazing @21shares_research explains.
So far, there have been 665 withdrawal requests.
The amount of actual $stETH requested for withdrawals has been huge though, almost 451k.
Why is the figure so large?
Well, the bulk of it was to a single staker - Celsius - who withdrew over 428 thousand $stETH alone.
Are these massive withdrawals a problem for Lido? No, because they were well prepared with a “buffer” of $ETH ready to cover the withdrawals.
According to the dashboard, the buffer:
“Comes from Partial Withdrawals, New ETH Deposits and Execution Layer Rewards”
On Tuesday, the buffer was at 452.6k $ETH. As Lido has honoured the large withdrawals throughout the week though the buffer has been dropping sharply, and now stands at 11.4k $ETH, according to the dashboard:
Overall, we can see that Lido has experienced a fairly extreme surge in withdrawals.
The overwhelming majority has been from one address associated with Celsius, something of a special case since they filed for Chapter 11 bankruptcy in July 2022.
New withdrawal requests are coming in over the past couple of days, but nothing too significant.
To learn much more, check out the full dashboard!
Uniswap Crosschain Users 🦄
In a new dashboard dedicated to Uniswap cross-chain user analysis, @BiffBuster poses an interesting question:
“Meme coin summer is off to a hot start following the recent run of $PEPE and other meme coins. With gas and transactions reaching monthly highs, are retail users coming back? Where are they buying these new meme coins? Are they new users or the same users trying to join the meme party?”
So what effect have the meme coin shenanigans had on the king of DEXes?
To answer this, the dashboard dives deep into some very interesting metrics. Let’s check it out.
Firstly, if you’ve been anywhere near crypto Twitter over the past month or two, you know it’s meme coin season. Meme coins typically start out as a joke, but can quickly rocket in value as the meme spreads and “investors” FOMO in.
This brings us to Uniswap.
Uniswap is by far the largest DEX on Ethereum with ~80%+ of users over the past year and the vast majority of volume:
These days though, Ethereum isn’t the only game in town. Uniswap has captured a smaller % of users on other chains over the past year:
~57% on Optimism
~40% on Polygon
~38% on Arbitrum
At the same time, these other chains are becoming an increasingly significant slice of Uniswap’s overall user base.
One year ago ~80% of total users were on Ethereum. At the beginning of 2023 this dropped below 50% for the first time:
In recent months, Uniswap has seen increased active users across chains. This has largely been driven by meme coin frenzy on Ethereum.
Even though we’ve been in a bear market, Uniswap has increased its DAU by 200% over the past year!
Arbitrum too has seen a strong growth of active DEX users.
Though Uniswap is in stiff competition with Sushiswap, Camelot and others - Arbitrum has certainly contributed to overall user growth:
Arbitrum isn’t only contributing in terms of users either. For the first time in recent months, Arbitrum has driven a significant portion of overall volume.
Because of the meme coin trend and FOMO, hundreds of new pools have popped up on Uniswap - notably on Ethereum & Arbitrum.
This is all good news for Uniswap, but has led to network congestion and high fees for regular users.
Meme coins or otherwise, Uniswap is going from strength to strength lately.
Active users and other core metrics are looking better than any time since the market crash one year ago.
Uniswap has also maintained and cemented its position as the king of DEXes after a smart cross-chain expansion strategy that paid off.
Check out the full dashboard for more.
BNB Chain ⛓️
Since launching in 2020 in the wake sky-high Ethereum fees, BNB chain has become a key fixture of the wider crypto ecosystem.
A new dashboard by @KARTOD breaks down BNB chain in depth. Let’s look at the key metrics.
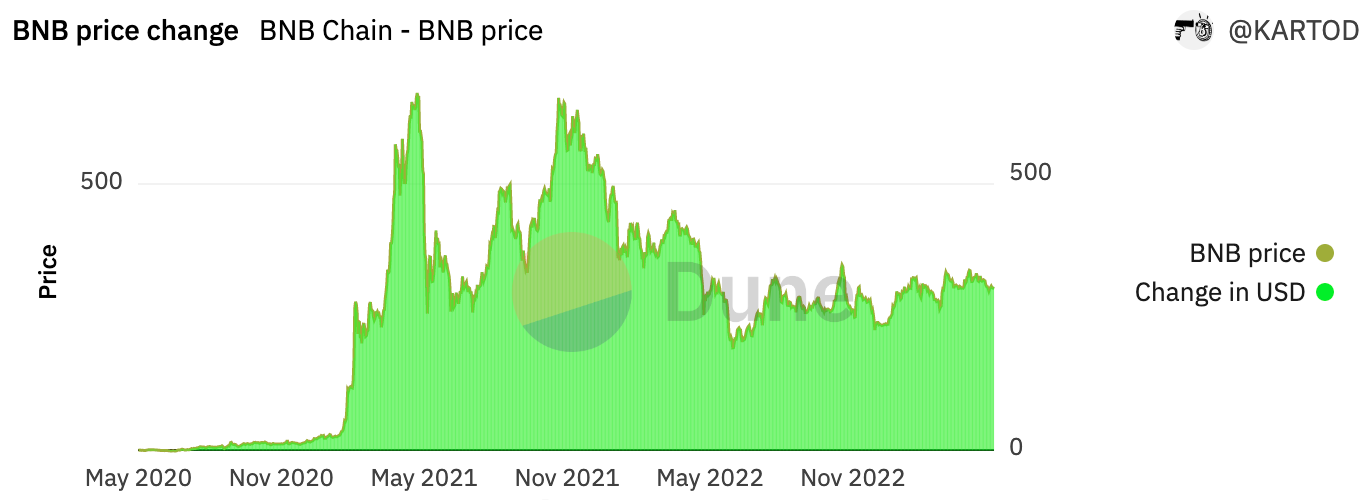
BNB hit the primetime from late 2020 onwards, after its native token went on an epic run from ~$30 to $650+ in 6 months:
It’s sitting at ~$314 right now. Way off its high, but holding up relatively well throughout the bear.
At the same time that $BNB was peaking in price for the second time in late 2021, so were the chain’s users and transactions.
Transactions were hitting over 13 million daily in late ‘21. Through much of 2022 they dropped to a more sober (yet still significant) ~3-4m. Transactions are picking up again over the past few months:
BNB has processed a whopping 3.86 Billion transactions in total!
When we look at active users, the trend is less stark. Although there were drops in line with $BNB price and overall transactions, BNB seemed to retain its users well throughout the past 2 years.
Again, active wallets are increasing in recent months:
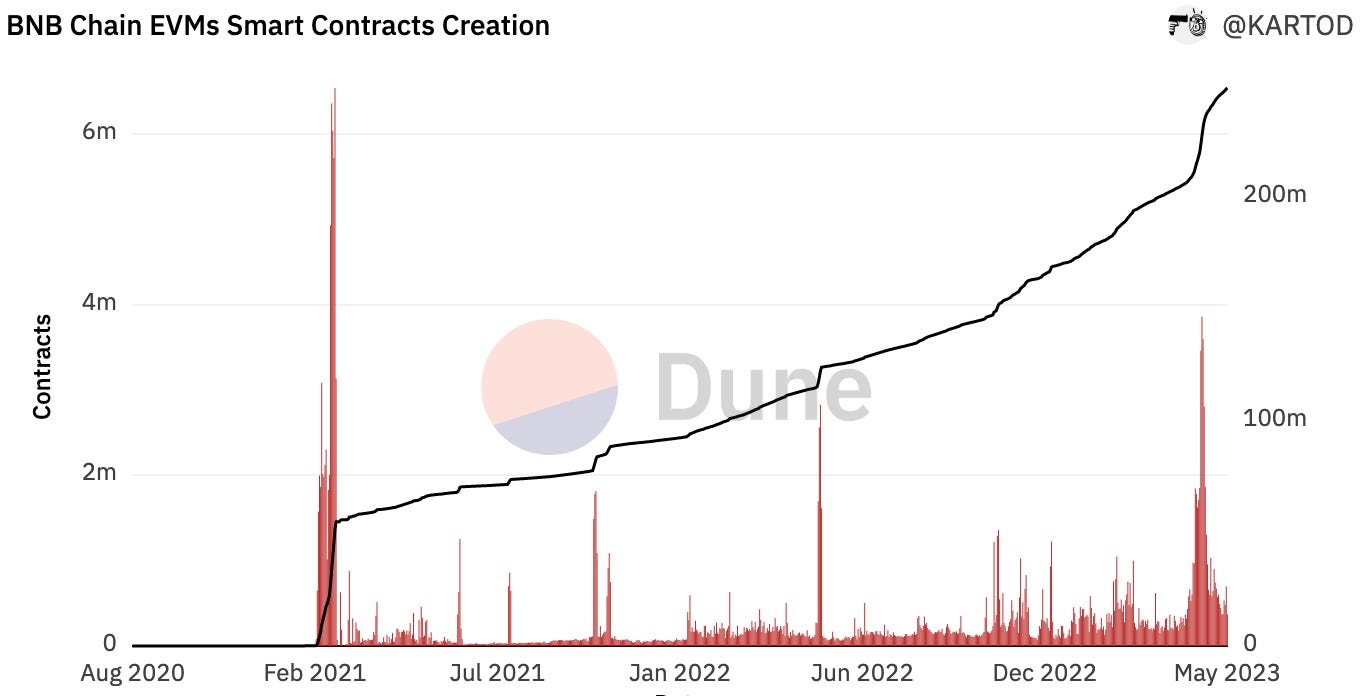
Smart contract creation follows an interesting trend.
There was a massive spike soon after the chain launched, with 50m+ contracts deployed in a matter of weeks. Then there was a relative lull for 2 years, before contract deployments picked up again this year:
DEXes are some of the most popular DAPPs on BNB. The dominant player is Pancakeswap, which beat the competition in 2021 to take ~90% of the market in 2022.
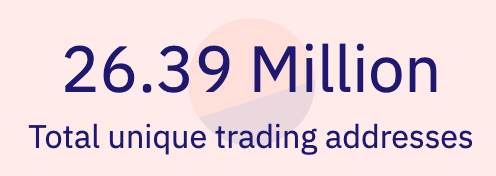
Over 26 million addresses have traded on one of BNB’s DEXes:
Overall we can see that BNB is one of the leading chains in terms of users and transactions.
Not only has it survived the recent bear market, but it has been doing rather well, particularly in recent months which have seen strong growth in core metrics.
Check out the full dashboard for much more.
DEX Aggregators 📈
Unsurprisingly, the meme coin trend has given a healthy boost to DEX aggregators as well as DEXes themselves.
A new dashboard by top team @sixdegree breaks them down in detail, let’s look at the highlights.
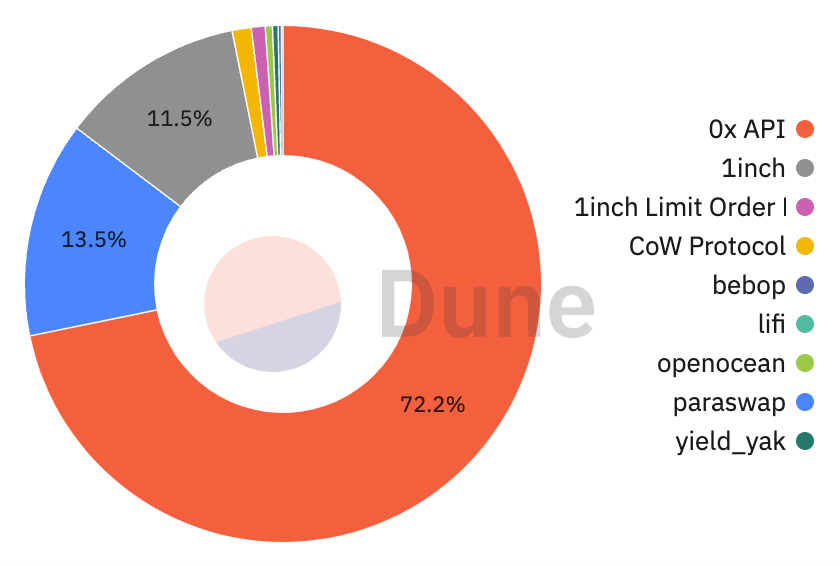
There are two DEX aggregators leading the market over the past year: the 0x API & 1inch.
0x drives by far the most trades - over 72%:
On the flipside, 1inch processes ~60% of value. When it comes to unique users, the two are roughly equal, followed closely by Paraswap.
Except for one large spike in Q1, overall aggregator volume has been reasonably flat for the past year:
Recent months though have seen daily trades cross 100k, with active users also soaring past the 20k mark:
Where 0x really leads is in individual trades. Over the past year though, competitors have taken a larger slice of the pie - with both 1inch and Paraswap gaining ground.
Over the past couple of months though, 0x has been looking strong on this metric:
So overall, the DEX aggregator space is looking relatively healthy, and has benefited from the recent degen activity around meme coins. A dominant market leader is also still yet to emerge.
For much more data - check out the full dashboard for more.
Multichain Transaction Fees 💳
Let’s take a look at how fees have trended over the past 6 months, courtesy of a new dashboard by @niftytable.
Firstly on Ethereum daily fees have skyrocketed since late ‘22, particularly over the past month when transactions hit $30m on several days:
Even more dramatic is Bitcoin, where fees were <1m daily for almost the entire period until the Ordinals and BRC-20 crazes spiked them to crazy multimillion dollar fee days in recent weeks:
Arbitrum shows a steadier but still impressive trend, with serious momentum building through late Q1 and early Q2.
Arbitrum fees are peaking right now:
Optimism shows a similar trend, while Polygon appears to have peaked in late April. BNB is an outlier, with daily fees relatively flat throughout the entire period.
Check out the full dashboard for more.
More Dashboards
GN
Thanks for reading - and as always a special thanks to all featured Wizards.
Have a good weekend, and see you next week for more data, dashboards, & Wizardry.


great update! thx!
hiii