
Dune Digest #69
Dune Digest #69
$BLUR, NFT mints, Bitcoin coin days, & MORE.....

GM
gm gm - welcome to issue #69 of Dune Digest!
We shipped a few cool product improvements for you this week.
For a start we’ve upgraded and relaunched labels.
It’s now much easier to filter by category and label types.
Want to get all identifiers? Just join labels.all and filter for identifier label types.
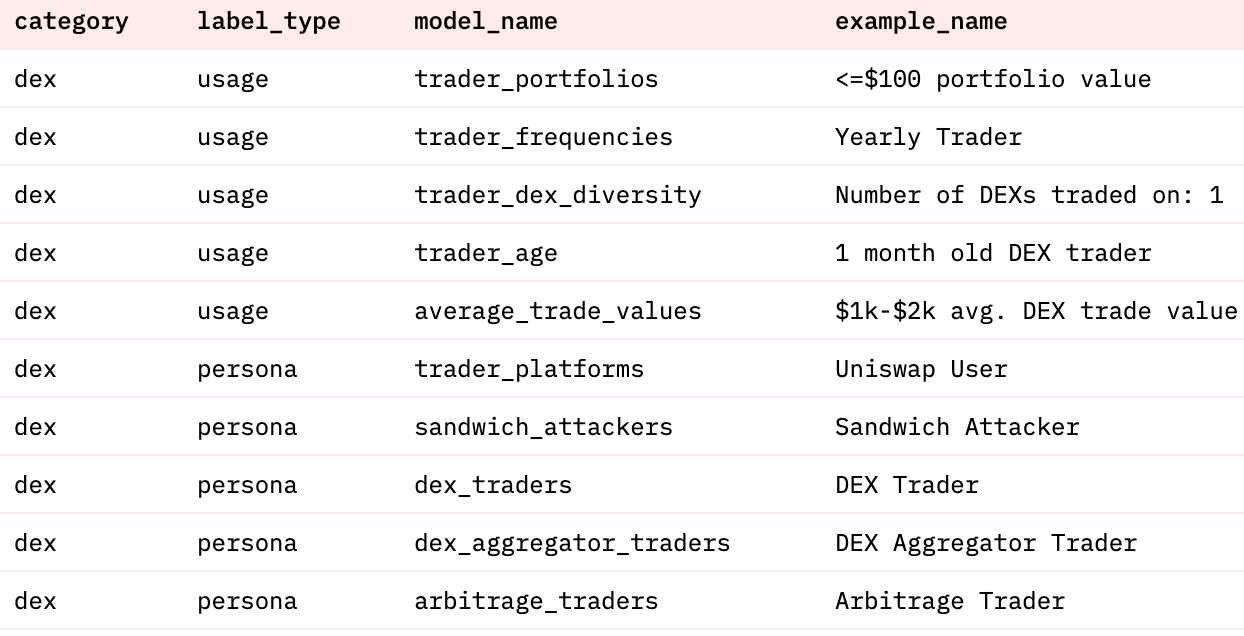
You can check out our 7 default categories with this query - and learn more in this updated readme.
Dune’s CEO Fredrik Haga also published a new article on our blog.
In the article, he explains a metaphor we use internally at Dune - the backpack - and how it relates to growing and scaling a startup through the good times and the bad.
Now, let’s get into the data…..
$BLUR Airdrop
The big event in crypto this week was the $BLUR airdrop.
How did it go? Let’s review the key stats through a great dashboard by @pandajackson42…..
360 million $BLUR tokens were dropped in total.
With 57 days to go, over ~92.5%, have been claimed already:
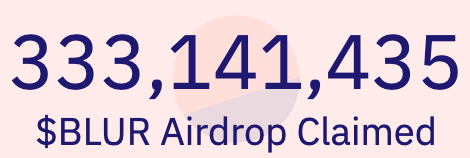
Around 101k eligible wallets have claimed the drop.
What did they do with it?
As we know from @jhackworth’s fascinating analysis, the majority of airdrop recipients tend to dump immediately.
Has anything changed? Well, not really.
Over 71.2k wallets dumped their tokens immediately:

Of the remaining ~30%:
16.6% deposited to a CEX
22.3% did nothing
2.3% bought more!
The average drop was ~3.3k tokens, and the median just 366.
In today’s prices that’s $2937 and $325.74 respectively.
Not bad for free money, but not earth-shattering for the average recipient either.
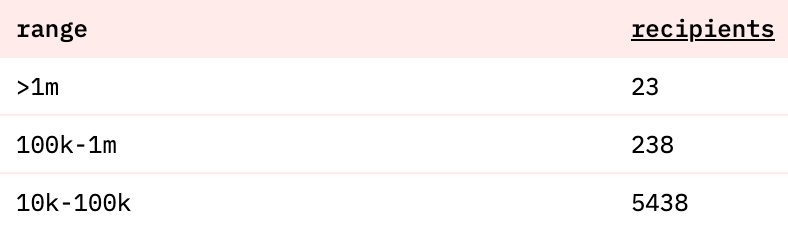
<6% received over 10k tokens:
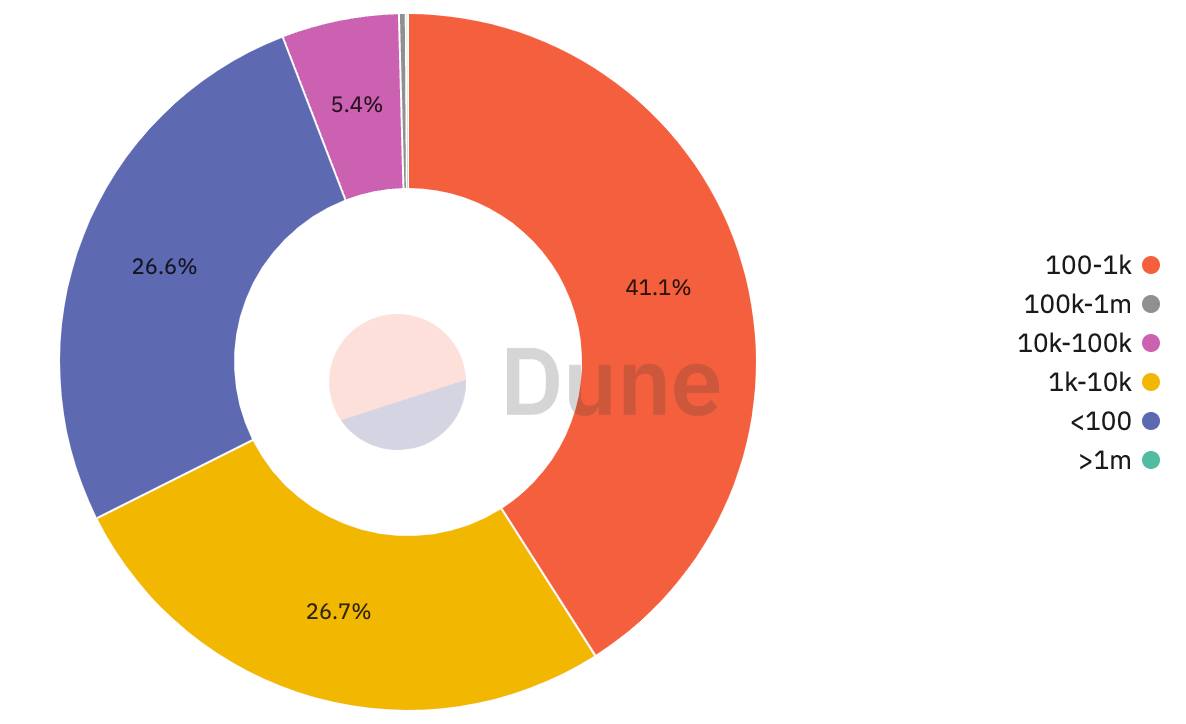
The drop was kind indeed though to high volume pro traders, with ~5700 receiving more than 10k tokens.
At the very top, 23 extremely high volume traders received over 1 million tokens!
All in all the airdrop went smoothly and successfully.
As usual the majority took the quick exit, the Whales got outsized drops, and $BLUR is now circulating in the DeFi ecosystem.
Congratulations to Blur and to everyone who got an airdrop.
Check out the full dashboard for more.
Bitcoin Coin Days Destroyed
Now that we have Bitcoin data live on Dune some Wizards are building interesting dashboards looking into specific metrics.
One such metric is “coin days destroyed”, explored in a recent dashboard by @sixdegree.
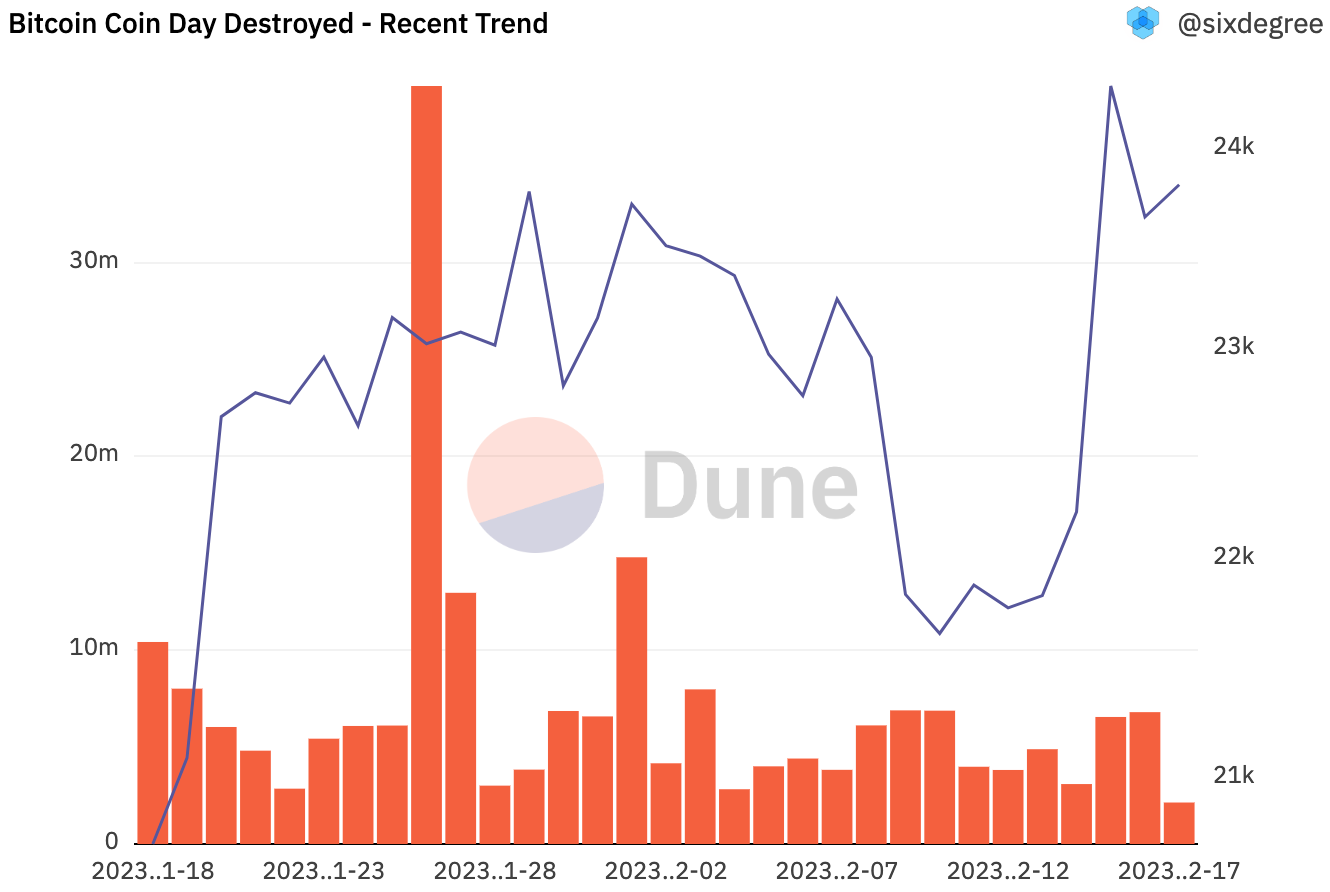
"Coin days destroyed" measures both the amount of bitcoin being transacted with, and the length of time that bitcoin has been held in a particular wallet - giving more weight to coins which haven’t moved in a long time.
Team @sixdegree explain it well:

Recent trends do not show anything particularly surprising, except for a large spike on the 26th of January.
When we zoom out for the entirety of Bitcoin’s history over the past 14 years, we can predictably see a gradual increase in coin days destroyed, with spikes loosely correlated with sharp price movements and shifts in market sentiment:

An important metric to keep an eye on if you’re interested in following the behaviour of bitcoin holders.
Check out the full dashboard for more…..
RWA Tokens
One narrative we keep hearing recently is “real world assets” and how they could be a catalyst for the future growth of crypto and DeFi.
A new dashboard by @j1002 tracks several important small cap RWA tokens:
$wCFG
$MPL
$GFI
$FACTR
$ONDO
It shows that while still small, this is a growing category, with holders more than doubling over the past year:

Over 48k addresses have interacted with these tokens in their history.
These tokens have seen some lively DEX trading activity which peaked in Q1 of last year.
In total they’ve driven over $1B of DEX volume, but have certainly dropped off over the last couple of months according to the dashboard.
So there’s nothing too encouraging happening as far as DEX action, and though token holders have increased over the past year by more than 100% - they’re still relatively small.
There’s a lot of room for growth for these tokens, and if the RWA narrative does play out they could become important assets in the future.
Check out the full dashboard for more.
NFT Mints
@niftytable is one of the OG Dune Wizards, and particularly deep into NFT research.
This week he published a thread on NFT minting data, based off a very interesting recent dashboard. Let’s look at some key stats…..
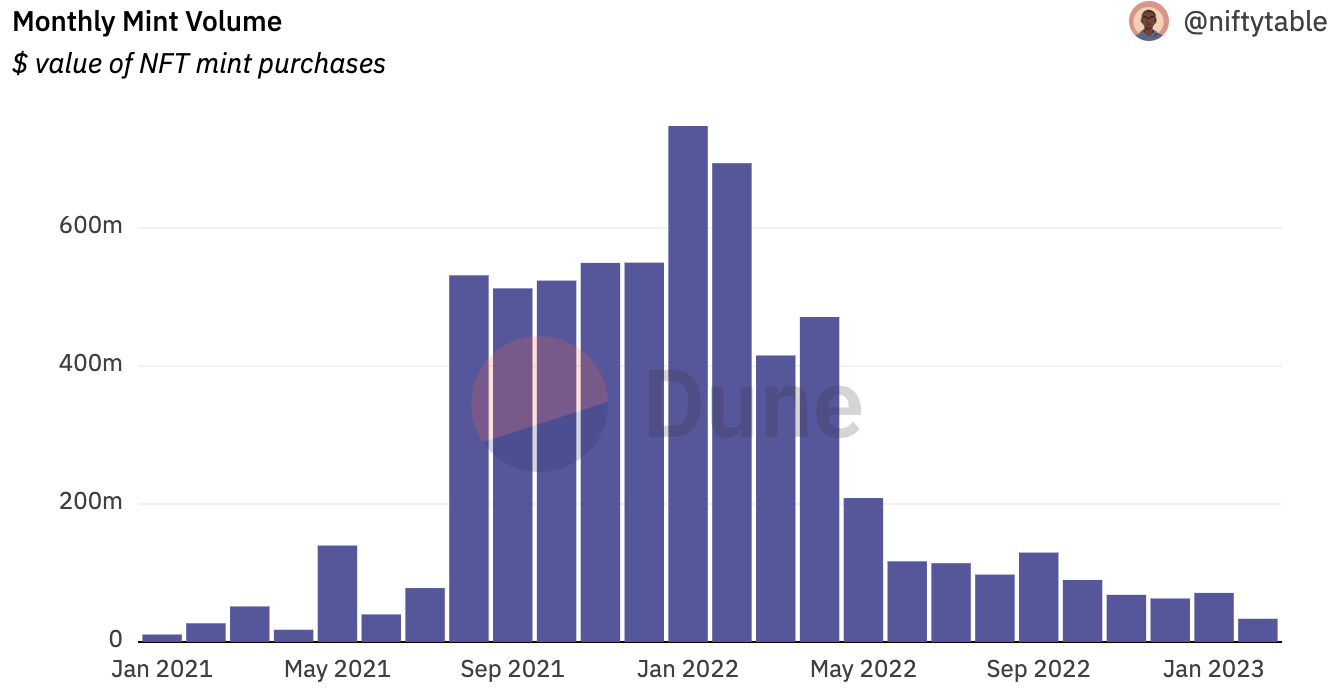
Though NFT mints might not be as hot as they were one year ago, they’re still big business - with almost 1.5 million mint transactions generating just shy of $80 million over the past month:

Though still a sizeable amount, monthly mint volume is way off its peak, which hit in January ‘22 at almost $750 million!
Mint volume dropped steadily through Q1 of last year, followed by a significant drop after May’s market crash.
Paid mints also make up a smaller % of overall NFT volume, compared to secondary sales.
For the past several months mints have driven 5-8% of the total, in the past this has been as high as 40%:
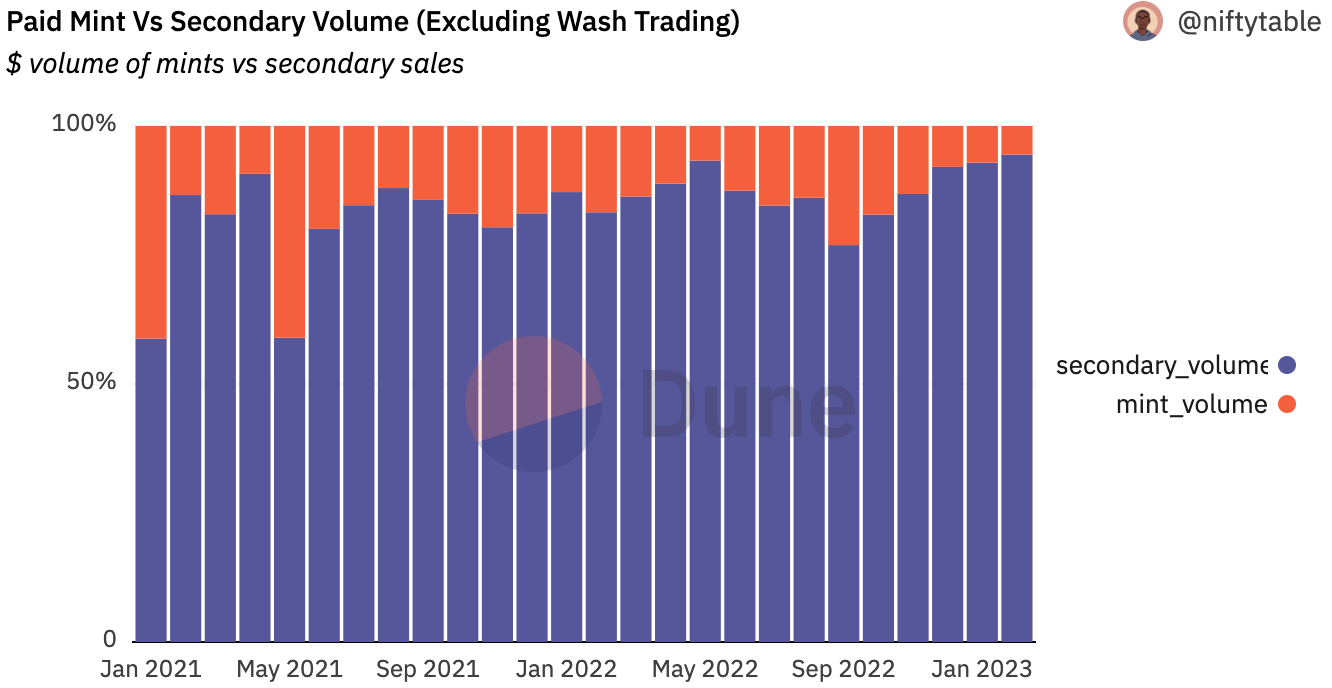
Remember, this is volume in $ terms.
It doesn’t mean that interest dropped off.
In fact, it has been quite the opposite.
Monthly mint transactions slowly grew through 2022, hitting an ATH in September at almost 2.7 million…..

The world of NFT mints is still going strong!
To learn more read @niftytable’s thread and check out the full dashboard.
Also, if you like Dune Digest, you’ll like his new newsletter 0xTrends.
Blur vs OpenSea
One year ago it appeared that LooksRare and X2Y2 were powerful newcomers that could challenge OpenSea’s NFT marketplace crown.
Since then, we learned that a large majority of their volumes was a mirage, driven by sketchy wash trading.
The real competitor didn’t emerge until the latter part of the year - and recent analysis by @hildobby suggests that their volume is likely legit……
So now it’s all about OpenSea and Blur, and we have a new dashboard by @hildobby to compare the two - let’s take a look at the key metrics:
Firstly, over the past week, OpenSea has had approximately double the traders:

OpenSea has also had 3-5x more weekly users since Blur launched.
When it comes to individual trades, it’s a similar story, with OpenSea consistently seeing 2-3x Blur’s figures. Blur did gain ground here though in the last weeks of 2022:

This isn’t surprising, considering both OpenSea’s huge head start and Blur’s positioning as a more high end pro trading platform.
What has surprised many is Blur overtaking OpenSea in volume for the first time recently.
Blur has had consistently higher volume for 8 of the past 10 weeks - and has seen higher daily volume for the majority of February so far.
Over the past week, Blur has seen ~2.5x OpenSea’s volume:

It’s important to note that Blur is both a marketplace and an aggregator - and the above metrics count them together.
When we compare the two marketplaces directly, OpenSea’s lead in users and trades becomes even more dramatic - and Blur’s lead in volume looks less significant.
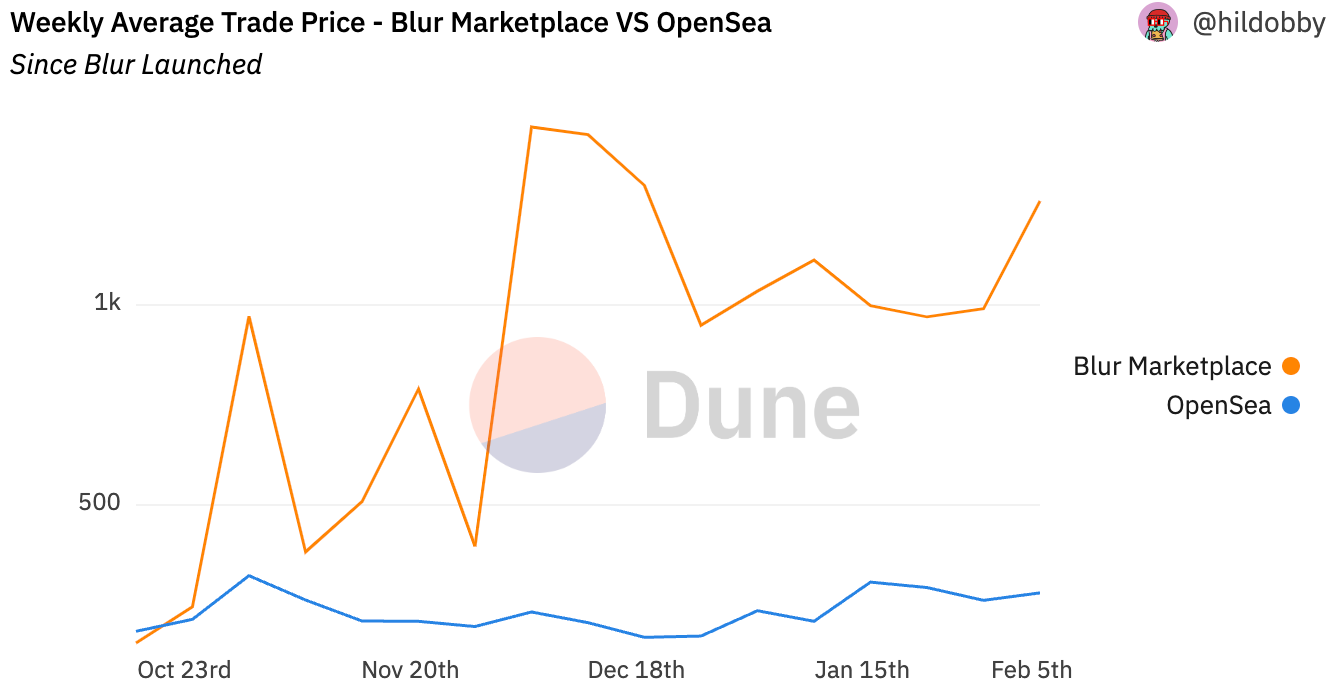
It’s still there though, and Blur achieves this through a much higher average trade price.
Soon after launch the average trade on Blur soared, and has been between 2-6x higher than OpenSea’s since.
When comparing Blur Aggregator with Gem, we can also see than Blur is significantly ahead in every key metric.
Overall, what does this tell us?
If we accept that Blur is not reliant on wash trading, then it appears that they executed one of the most successful product launches in recent Web3 history.
Not only have they legitimately challenged OpenSea’s dominance for the first time, but they seem to have succeeded in positioning themselves as a high-end, pro trader tool for the NFT elites.
Could they capture this lucrative market further, while OpenSea becomes the “NFTs for the masses” platform?
We will have to wait and see. In the meantime, keep an eye on the dashboard to follow the action…..
More Dashboards
GN
Thanks for reading this issue - we hope you enjoyed it!
Of course, a special thanks to all our great Wizards who contributed.
See you next week for more data, dashboards and Wizardry.
awesome
thats great and informative...