

Dune Digest #63
Ethereum, Polygon, Safe, Optimism NFTs, L2

GM
Welcome to issue #63, the first (of many) Dune Digest issue of 2023!
Happy New Year to you all.
Firstly, some Dune news…..
DAO Spells
Wizards will now have the tools to dive much deeper into the world of DAOs. We created a whole new spell category for DAOs, and 2 new spells:
dao.proposals for useful governance data across proposals
dao.votes for a detailed view on votes for a given proposal ID
We’re looking forward to wizards contributing to these datasets, and lifting the lid on the entire DAO ecosystem in the near future!
Read more on github, and check out this example dashboard by @soispoke for a taste of what’s now possible!
Now, let’s get into the data……..
Ethereum
At the tail end of 2022, @blockworks_research put out a fantastic dashboard: Ethereum Asset Profile.
Let’s kick off the year with a look at some of the major eth trends of the past year…..
Considering the volatile markets, Ethereum had a solid 2022.
Core usage metrics remained stable. Active users, for example, remained at a steady 5m+ monthly (apart from June):

Transactions also remained at 30m+ monthly, a relatively minor dip from 2021.
Not everything stayed so high though.
Throughout 2022 users paid $4.1 billion in transaction fees. This wasn’t equal throughout the year though, with fees dropping in Q1, and slowing to a crawl by Q3 as the bear market hit.
Over the past 30 days though “only” $92m worth of fees came in:
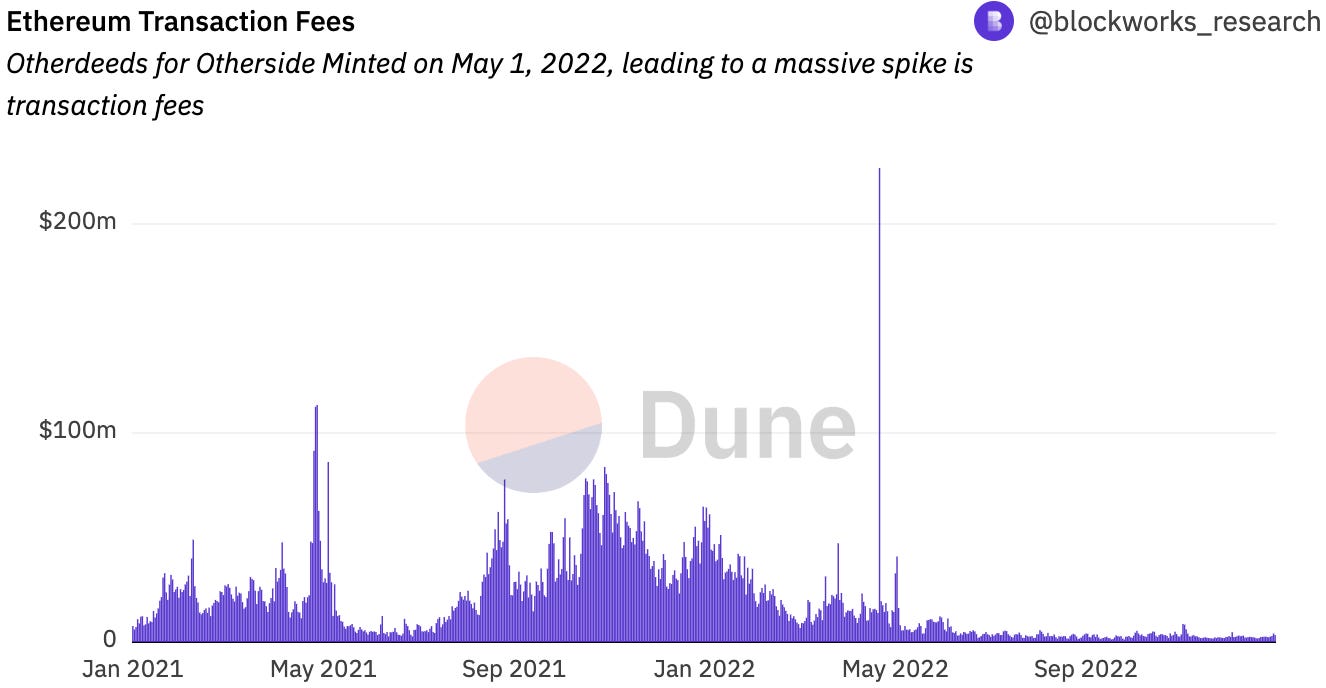
The flipside of this is that gas fees were more affordable on the network than they’d been in a long time.
At the beginning of 2022, it would’ve cost you $10 to do an $ETH transfer, $80 for a Uniswap trade, and ~$100 for an OpenSea buy.
Crazy!
By late December it would have cost $.40, $4 & $3.5 respectively.

2022 was also a huge year for staking. Almost ~7m $ETH were staked throughout the year.
77.5% of stakers are underwater, meaning they deposited above the current $ETH price…….

It’s impossible to do this dashboard justice in a short newsletter piece.
There’s so much more interesting data on supply, economics, popular contracts, and many other interesting metrics.
If you’re interested in Ethereum, you should definitely check it out…….
Polygon
This week top Wizard team @sixdegree put out the latest dashboard in their chain overview series.
It thoroughly covers Polygon, a chain which had an interesting 2022, so let’s recap.
Polygon is a fast, scalable chain. It processes 27.5 blocks per minute - over 37.7 million in total so far.
Throughout 2022 block counts remained relatively stable, down somewhat from 2020 highs:

When it comes to transactions, Polygon really got off the ground in Q2 of 2021, hitting an ATH a couple of months later.
Transactions declined into 2022, though remained fairly stable throughout the year.
When it comes to monthly users though - we saw explosive growth throughout the latter half of the year, especially in October when it peaked at over 6 million:

These highs coincided with a large spike in new users specifically - likely tied to the popular Reddit NFTs that were going wild around that time.
In general - Polygon onboarded new users impressively throughout the latter part of 2022:

According to the dashboard, in total, Polygon has seen over 33m users throughout its history.
Polygon’s native toke, $MATIC, kept falling through the first half of 2022 - losing ~80% of its value. Since late summer it saw a small recovery though and has been relatively steady since:
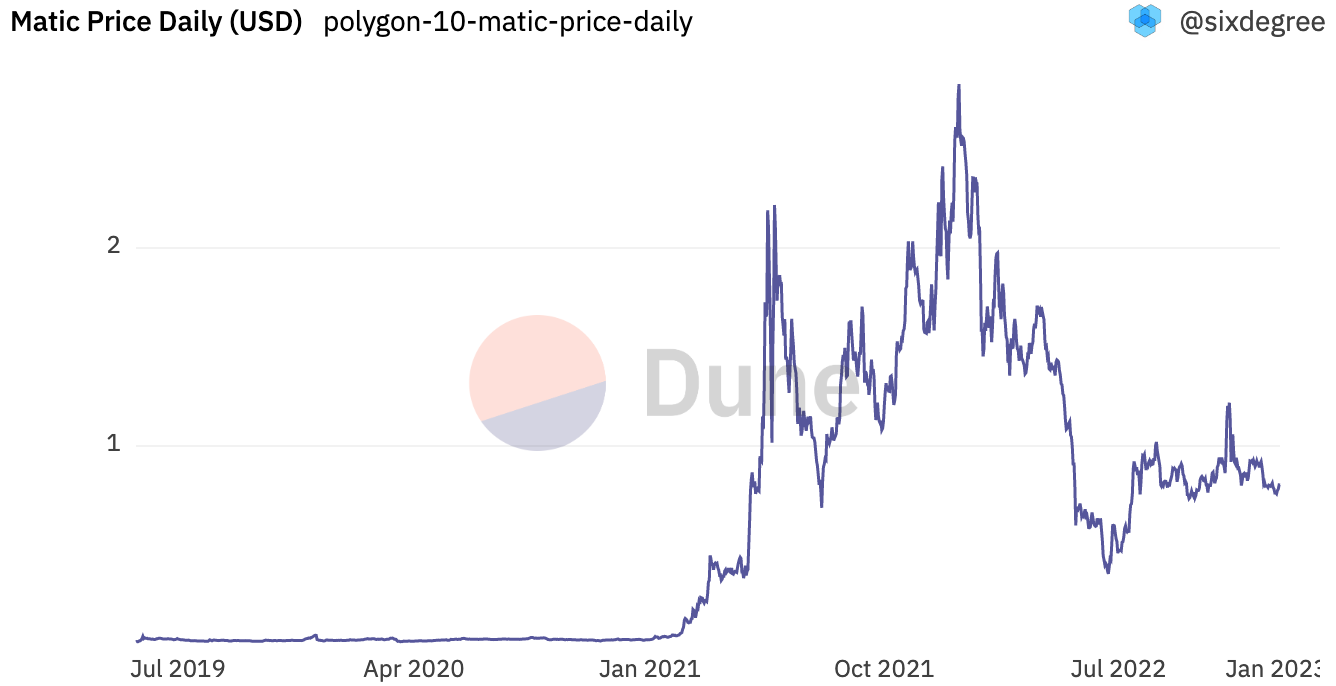
Overall, Polygon finished the year strong considering the wider markets.
It’s going into 2023 in a good position, and will likely remain a popular platform for launching experimental projects and onboarding new users into crypto.
Check out the full dashboard for more!
Safe Growth
At its core, Safe (formerly Gnosis Safe) is a collection of tools to create and manage multisig wallets.
Over the past few years, Safe became a crucial part of Web3 infrastructure - relied on by countless DAOs, Protocols and organisations.
We see a lot of great Safe dashboards on Dune, so were intrigued when we saw this Tweet by @IttaiSvidler, who persuasively argued that more teams are organising on-chain than ever, despite the turbulence of 2022:
In response, @frank_maseo posted an interesting thread and new dashboard that dives further into the data. Let’s see what it says……
Firstly, 2022 was huge for Safe adoption.
At the beginning of the year ~1.5k safes were created each week across supported chains. This started to really pick up throughout the year and really exploded in Q4 - peaking at 100k+ in late November:

The vast majority of this growth was driven by Polygon, and to a lesser extent Arbitrum & Optimism.
When it comes to Ethereum itself we still see strong (though less dramatic) wallet growth throughout the year.
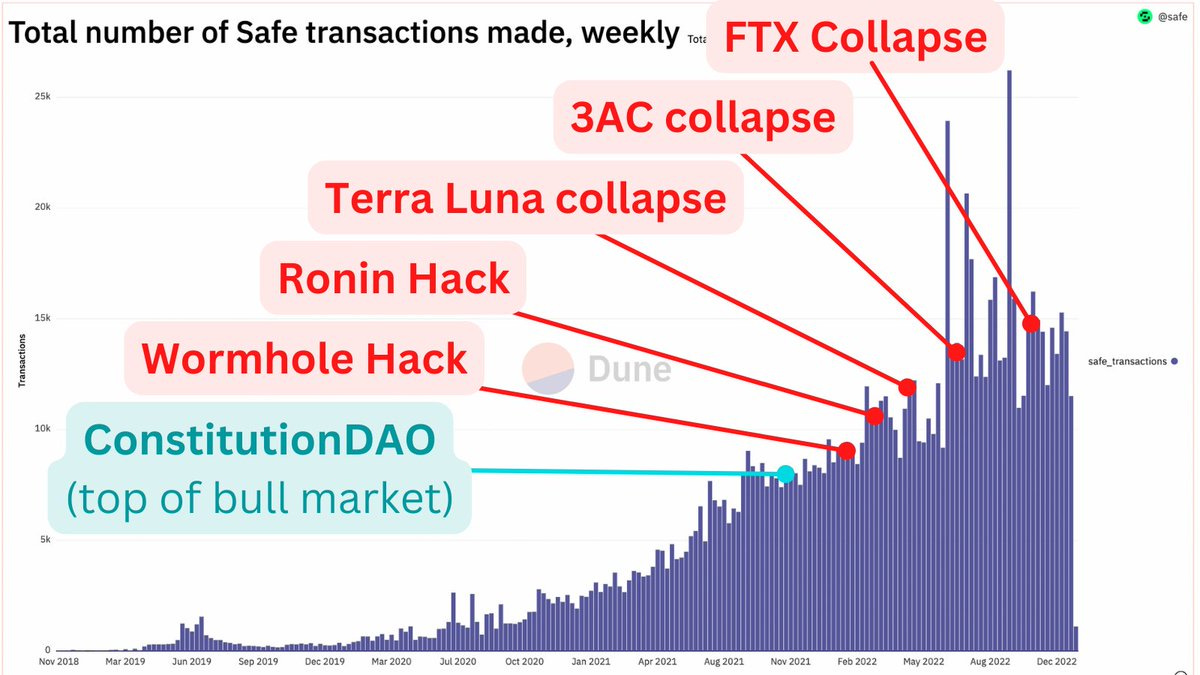
The same goes for transactions & ($ETH) volume, which both hit ATHs in ‘22 and stayed strong into the depths of the bear:

There’s more good news still for Safe on Ethereum.
In recent months, weekly active safes have been higher than ever after showing steady growth throughout the year:

When it comes to transactions on other EVM chains, the pattern is generally similar.
Overall, this dashboard supports the idea that more people are working together and collaborating on-chain than ever.
No matter how prices are looking, builders are continuing to build!
Check out the full dashboard for more……
Uniswap multichain launches
In 2021 & 2022, several large Ethereum protocols started to diversify by launching on other chains and the various scaling platforms that were emerging. A prime example was Uniswap, which launched on Optimism, Arbitrum and Polygon throughout 2021.
An interesting question now arises. How does launching on Ethereum scaling platforms affect the core protocol on mainnet?
This is investigated in an interesting recent dashboard by @rplust - let’s take a look……
Overall, Uniswap trade volume on Ethereum peaked toward the end of 2021 and steadily dropped through 2022.

When Uniswap launched on Optimism in July ‘21, there was a slight drop in mainnet trading volume.
The trend was weak though and quickly reversed later in the month.
As @rplust notes in the dashboard, this is surprising considering that users now had a cheaper & faster alternative.
It was a similar story with the Arbitrum launch 6 weeks later - mainnet trade volume was not affected noticeably:

The Polygon launch at the end of December '21 was a different matter.
Here we can see a decrease in mainnet volume that coincided with the launch. That said, the two aren’t necessarily connected, since a downturn was already in swing:

So we can say that there’s not much impact of the L2/sidechain launches on mainnet trading volume whatsoever.
@rplust also analysed liquidity levels, finding that mainnet liquidity was also largely unaffected by the 3 launches.
Overall, this dashboard shows that despite the option of faster, cheaper platforms - there remained a very strong demand for Uniswap on Ethereum L1.
As @rplust comments in the dashboard:
“As the demand for fast transaction times and affordable trading fees continues to increase, it will be interesting to see how the activity and demand on Uniswap in these Ethereum-scaling solutions/L2 chains evolve over time”
Check out the full dashboard for much more data…….
Optimism NFTs
We’ve all heard a lot about how NFT volume on Ethereum has cratered in recent months - but how about on L2s like Optimism?
A new dashboard by @oplabspbc dives deep into the secondary sales market on Optimism. Let’s take a quick tour of the highlights…..
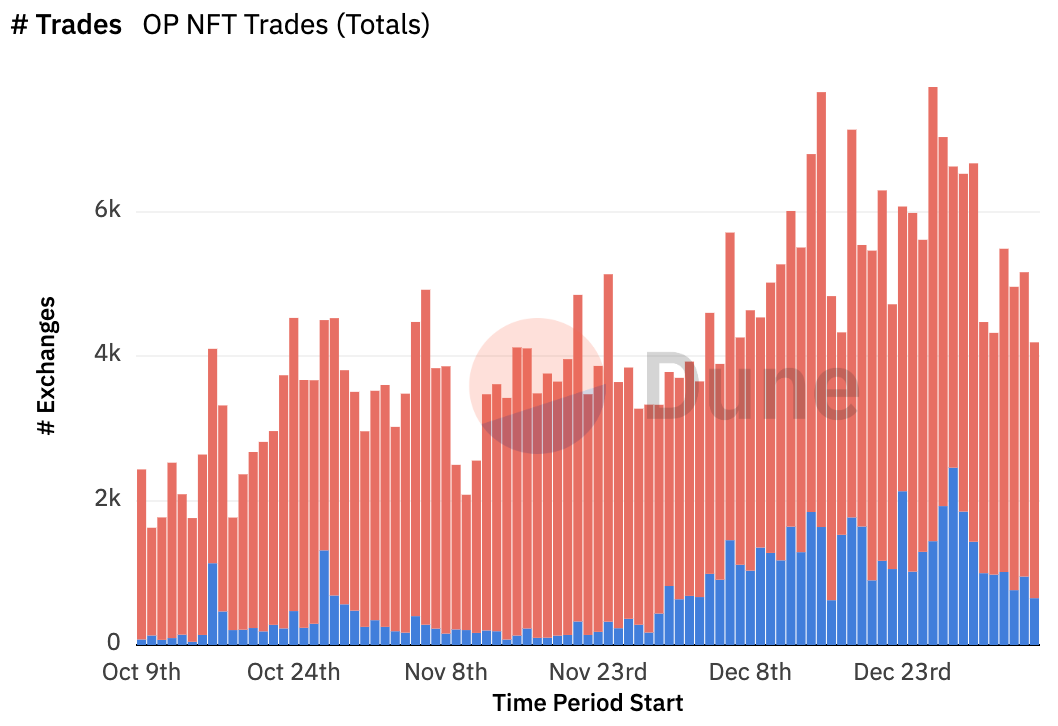
Over the past 90 days, in the depths of the bear market, Optimism has averaged 38.65 $ETH in daily volume from 4.1k trades.
Volume stayed relatively flat throughout Q4, but daily trades actually grew nicely over the holiday period (Optimism NFTs for Christmas presents?):
In Optimism land, OpenSea takes a second seat. The leading marketplace is Quix, which accounts for >80% of total volume!
OpenSea did have a low of catching up to do though. They only launched on Optimism at the end of September, and by mid October were seeing ~100 daily users.
By late December though OpenSea were seeing 800+ daily users, while Quix also saw a surge to over 6k on Boxing day:

The collection that seems to have driven this Q4 growth is Optimism Quests, which grew significantly as a share of trades and volume throughout Q4.
An interesting dashboard giving a nice overview of the nascent Optimism NFT scene. Check it out for much more data!
More Dashboards
GN
Thanks for reading - we hope you enjoyed this issue.
As always, a special thanks to all the amazing Wizards for your contributions this week.
We’re excited to bring you more weekly data, dashboards and Wizardry throughout 2023!
We’ve also got some very exciting news for you next week, so stay tuned.
In the meantime……..