Dune Digest #59
Goereli, L2s, DEX, Blue Chips & More!

GM
Welcome to issue #58 of Dune Digest!
Let’s start off with some news for the week.
Goerli
We’re excited to announce that data from Goerli, Ethereum’s most important testnet, is now live on Dune Engine v2!
Goerli is where developers go to test out new protocols, dapps, and MVPs in a safe environment before they launch them on the real deal.
Now Dune wizards have a new environment to investigate. They’ve already begun - check out these dashboards:
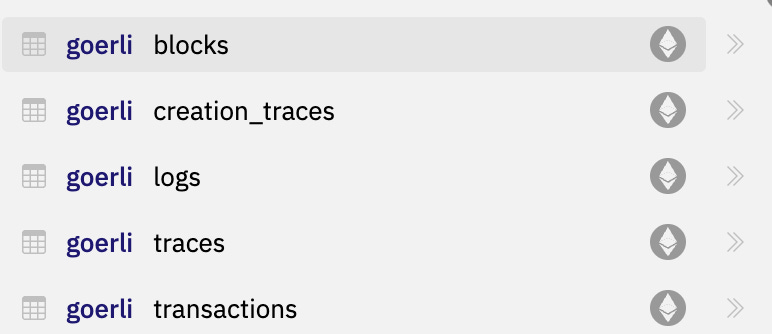
There are currently 5 tables live:
And decoding will be available next week!
As always, we can’t wait to see what you build……..
12 Days of Dune
The year isn’t over yet - there’s still time to level up as a Wizard in 2022.
The perfect way to do that is to join in 12 days of Dune on Monday.
@agaperste and @andrewhong5297 will be taking participants through 12 days of Wizard training. You’ll tackle 12 increasingly complex challenges on Uniswap V2, and finish the year with an upgraded skillset.

You can learn all about it in this video, and read more details here.
Join us on Monday, see you there!
Network Penetration
We introduced the concept of network penetration in last week’s newsletter. This week, we published the full article, written by Dune Wizard @frank_maseo.
Now, let’s get into the week’s data & dashboards…….
2022: The Big Trends 🔍
It’s nice to see dashboards now and again that give a high-level, bird’s eye view of crypto.
One such dashboard came across the Dune Digest desk this week by @claplace.
We know things haven’t been great in the industry recently, but are things really that bad? Let’s investigate…….
Daily transactions across major chains are way down from their 15m+ highs in late 2021.
This metric seems to have bottomed in late Summer though, and has been increasing slightly over the past couple of months, creeping closer to the 10m level yet again:

The dynamic between chains in 2022 is also interesting. How did the big players fare throughout the year?
BNB - the largest chain by transactions lost some of its dominance through 2022, dropping from ~60% of total transactions in January to ~40% in recent months
Ethereum - the king by volume steadily grew its share of transactions through the year, peaking in Summer at 15-20%. Recently, it has lost share to its own L2s
Polygon - emerged as an important chain this year, with its share of transactions jumping from ~25% to ~35%
Optimism & Arbitrum - grew their slice from <1% to 10%+ through the year, seeing huge growth since the end of Q2
Avalanche - peaked in Q1 and declined in transaction share since, going from ~10% in February to <2% over the past quarter
Gnosis - stayed niche throughout the year accounting for 1-2% of transactions

The dashboard also covers the DEX market, but we’ll skip that as we’re dealing with DEXes in the next story.
Instead let’s take a look at NFTs. We all know that the NFT market, in $ volume terms, is down bad.
Volume is a fraction of what it was, dropping from daily highs of over $200m in Q1 & Q2 to <$10m over the past few months.

OpenSea lost the most, mainly because they had the most to lose.
But OpenSea also found itself in an increasingly competitive environment through the year as new NFT marketplaces launched left and right.
In January, OpenSea was in a dominant position, capturing 95%+ of the market. Its lead slipped throughout Q3 & Q4 though as newcomers like X2Y2, Gem and LooksRare gained traction.
In recent months, Blur has been the main challenger, and OpenSea looks to be finishing the year with around 50% of the total market across several core metrics:

Though OpenSea is still overwhelmingly the market leader, the competition is likely to stay hot into 2023……
Another major trend in 2022 was an uptick in banned and blacklisted addresses.
August and November saw the largest spikes in blacklists so far for $USDC, bringing the total to 151 banned addresses with over $7.3m locked:

Considering the increased regulatory scrutiny expected in the coming years, this is a trend that could accelerate.
Overall this is a nice dashboard for tracking high level trends, check it out for more.
DEX Deep Dive 📉
In the weeks following the blow up of FTX it was widely noted that the failure was one of CeFi, not DeFi.
Many speculated that users would abandon centralized platforms and flock to DEXes in droves.
As a prediction it seems plausible, but are we seeing it play out in the data? A new dashboard by @jhackworth investigates, let’s see what he found……..
The dashboard shows that there was a significant spike in DEX volume following the FTX implosion, albeit smaller than the one following the Luna collapse in May.
Since mid-November though, volume has dropped to 1 year lows:

When we look at users, there’s less of a noticeable impact.
Active DEX traders bottomed out around June, and steadily climbed through the second half of the year.
They peaked in late October, saw a small spike during the FTX drama, and have been on a downward slope since.

So there seems to be no dramatic move to DEXes, yet at least.
In fact, the core metrics we’ve looked at so far seem to suggest the opposite.
The picture changes when we look at new users more closely though.
Even though total active traders are down, new users have shot up over the past month - and over the past 2 weeks in particular:
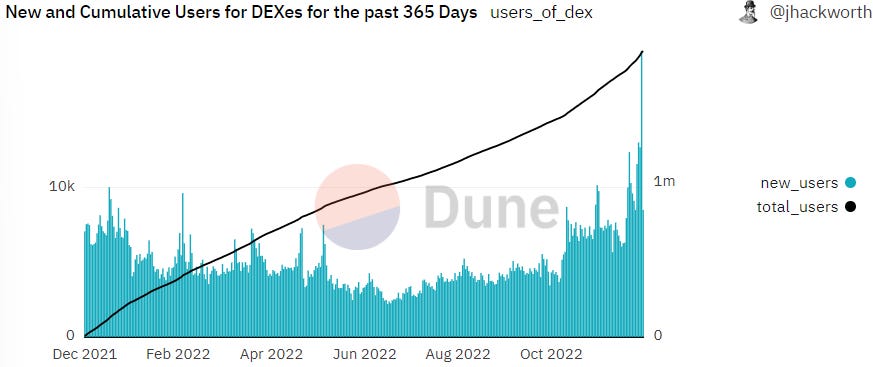
New traders have been making up an increasingly large % of the total, perhaps suggesting that DEXes are not retaining users well in recent months.
Let’s get a little more context around DEX users in general.
Firstly, DEX users are a small slice - less than 5% - of total Ethereum wallets. Over 90% of them are using Uniswap.
The majority are trading relatively small amounts, with 80% doing <$10k of volume and 50% <$1k.
Frequent traders are also in a minority, with only 22% having done more than 5 swaps:

The actual amount of individual wallets using DEXes frequently to trade seems pretty low.
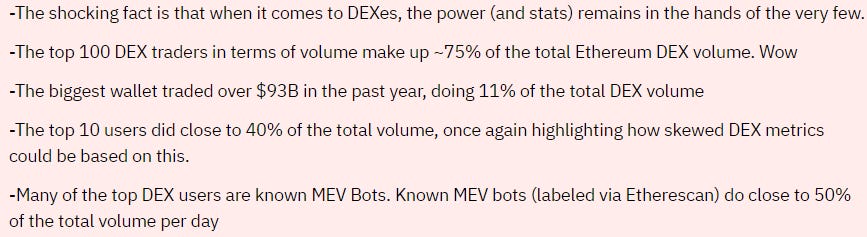
Where does all this crazy DEX volume come from then, $800b+ over the past year?
Well, let’s say it’s lonely at the top.
@jhackworth suggests that a large part of DEX volume is something of a mirage, with the top 10 users accounting for 40% of total volume and one wallet doing 11% of the total alone.
This is interesting, and sobering context. Perhaps this is the reason why the needle hasn’t moved that much on core DEX metrics as burned traders flock to DeFi?
Although new users are up in an encouraging sign, the vast majority of volume & swaps are from whales and MEV bots that can’t operate on CEXes anyway.
DEXes also seem to have a low retention rate, and the majority of wallets on Ethereum have never interacted with them!
It’s still early days, these trends often play out over several months or years. Keep in mind that conclusions about users can also be skewed by looking at individual wallets in isolation.
But from what we’ve seen so far, this mass exodus to DeFi and DEXes in particular doesn’t seem to be materializing. Maybe we need to wait until the next bull market?
For more, check out @jhackworth’s amazing dashboard, and the thread he wrote about it too!
Goerli Developers ⚒️
Crypto developers need to test their applications thoroughly before launching. For this they use a “testnet”.
A testnet is a separate blockchain used to test new protocols, apps, upgrades, smart contracts and MVPs in a safe environment where real money isn’t at risk. On Ethereum, the most popular testnet is Goerli.
Since we now have Goerli data live on Dune, and @niftytable has provided us with a dashboard, we can take a look under the hood…….
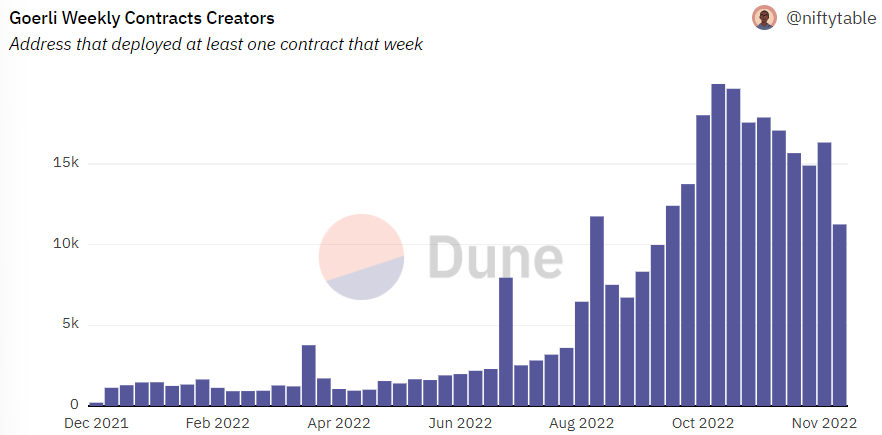
We can see that despite the bear market, weekly contract creators on Goerli have never been higher.
In Q1 & Q2, there were typically 1-2k contract creators per week. By Q4, this figure had grown 10x!
There has been a lot of activity on Goerli since late summer:
When we look at weekly contracts created it’s a similar story but a little more volatile. We still see an impressive growth trend in Q4. This peaked in the first week of November with almost 300k contracts created:

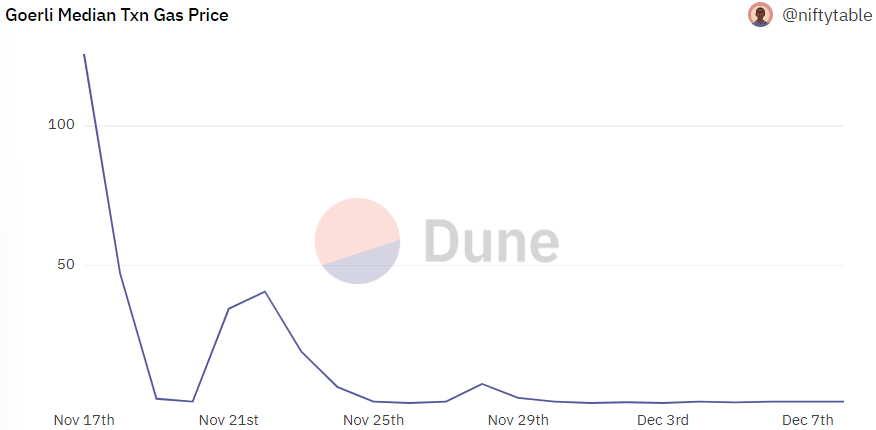
According to the dashboard though, gas prices seem to have flatlined over the past couple of weeks, dropping massively since mid-November:
A great early dashboard for Goerli. We’re looking forward to Wizards bringing their razor sharp analysis skills to this important testnet in the near future.
Check it out for more.
Blue Chip NFTs 🖼️
Back in 2021 and early ‘22, it sometimes seemed as if everyone and their uncle was launching an NFT collection.
We’ve heard tales that there are over 200 thousand NFT collections on Ethereum alone.
That’s a lot of JPEGS.
Many collections were launched by artists and entrepreneurs in the hope that they’d become the next Bored Apes, Doodles, or CryptoPunks. Out of the sea of projects, these “blue chips” rose to fame and commanded vastly higher prices.
How important are blue chips to the NFT ecosystem as a whole? A new dashboard by @sealaunch has the answers, so let’s take a look.
The dashboard classes the following collections as blue chips:
CryptoPunks
BAYC
Otherdeed
MAYC
Meebits
Moonbirds
CloneX
Doodles
It analyses the action on OpenSea, LooksRare, Genie, Gem, X2Y2, & Blur.
Let’s look at the king of marketplaces first, OpenSea.
Blue chip traders are a tiny minority on the platform, around .7%

Even so - they’ve represented almost 17% of total volume over the past 3 months, and on some days it’s 30%+

It’s interesting how just 8 collections drive such a huge chunk of volume compared to the tens of thousands of others on the platform.
When we look at some of OpenSea’s competitors, blue chip volume is even more crucial.
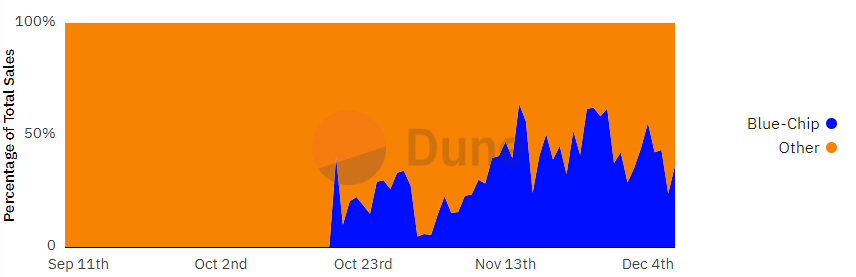
On newcomer Blur for example, blue chips are almost 30% of volume at <4% of traders, and since mid-November they’ve often driven 50%+ of daily volume:
Other marketplaces are even more dependent on blue chips for both volume and traders.
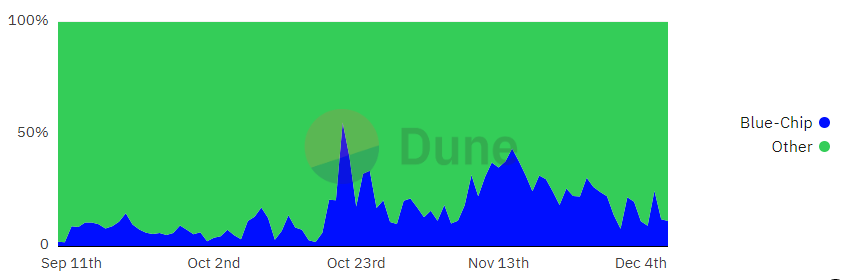
30.8% of LooksRare volume is from blue chips, for example, and it rises to 41.4% for X2Y2.
On LooksRare in recent weeks, 30%+ of traders are also there for these top collections:
What about the aggregators?
Genie and Gem seem to be less blue chip reliant, especially in terms of users. But they’re still crucial.
Overall, the NFT marketplace space is becoming increasingly hyper-competitive. An excessive dependence on blue chips could be a competitive weakness, as they’re overly reliant on prices holding up.
You can read more analysis in this thread by @sealaunch themselves, and don’t forget to subscribe to their newsletter where they post some great NFT analysis.
For much more data, check out the full dashboard……
Arbitrum ⚔️ Optimism
Coming into 2022, one of the big narratives was Ethereum scaling solutions, mostly in the form of L2 rollups.
This time, the narratives delivered, with both Arbitrum & Optimism performing well and becoming important parts of the ecosystem by Q3.
An excellent recent dashboard by @blockworks_research digs into the details of these two prominent optimistic rollups, and gives some interesting stats we haven’t seen before. Let’s take a look.
Both networks have grown significantly throughout 2022.
In January, they were seeing roughly 50k daily transactions combined. By Summer, this had grown to ~250k, split roughly equally between the two.
By September though, Arbitrum had started to pull ahead, and has since seen roughly double the daily transactions. Both have continued to grow impressively as mainnet transactions have dipped accordingly.

It looks like these L2s are indeed taking some of the heat off Ethereum itself.
It’s no surprise, users are saving themselves a significant amount in gas fees. Throughout the year Optimism has saved users 90-95% compared to L1.
The savings were slightly more modest (~85%) on Arbitrum for much of the year, but since the end of Q3 Arbitrum has been saving users 97%+!
Fees on both networks have been falling throughout the year, and especially through Q4:

Other KPIs also show a steady improvement in the performance and UX of these two networks.
For example, the time between batch acceptance on L1 has dropped by 80% from 5-10 minutes in early 2022. Recently, batches are accepted in <1 min on Optimism and <3 min on Arbitrum.
Both networks are also seeing a steady growth in contracts created throughout the year.
Another core metric is the share of total L1 gas that these L2s account for.
At the beginning of the year Arbitrum & Optimism were consuming .41% of all L1 gas. By summer this had grown 4x, and today it sits at around ~2%.
At the same time, other L2s like Aztec, ZkSync, Boba Network and others have grown too.
L2s in general now consume 2.5 - 3% of total Ethereum gas:

Users come to Arbitrum and Optimism to use a wide range of apps and protocols.
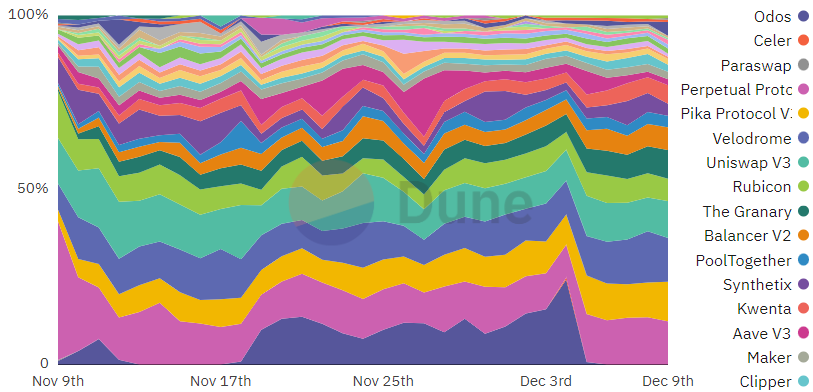
On Arbitrum over the past month - Odos, Uniswap, Beacon & Sushi have been particularly popular. Optimism is more diversified, but Velodrome, Perp Protocol and Pika have been particular crowd favourites:
How well are Arbitrum & Optimism retaining users? Pretty well it turns out.
Both networks have an 8 week retention rate of ~25%, which is excellent by traditional benchmarks.
It seems like 2022 was a great year for L2 rollups. The concept has been proven, they work, and users like them. The dashboard creators believe that they will grow exponentially over the next few years, and plan to add new L2s to the dashboard over time.
They could well be right - check out the full dashboard for more!
More Dashboards
GN
Thanks for reading, and as always a special thanks to all the featured Wizards for their great work.
You guys have been building like crazy recently, and the data is flowing like never before. In November, we saw an ATH for dashboards created - and they just keep getting better and better!
Enjoy your weekend and see you again next Friday.