Dune Digest #58
Network Penetration, Uniswap NFTs, BTC on Avalanche & more!
GM
Welcome to Issue #58 of Dune Digest!
Let’s start off with some Dune news…..
Meetups
Team Dune are getting around these days holding meetups in cities all around the world. This week we were in London, NYC, & Lisbon!
It has been brilliant to meet so many of you and hear your feedback & ideas for the future,
Today we’re at Eth India in Bangalore, if you’re there come say hi
Acaduneia
Did you know that some of the top universities & research institutions around the world use Dune?
This week we published an article summarizing 5 interesting recent papers that use Dune data. The topics are:
Scalability and fragmentation in crypto payment systems
NFT product/market fit and pricing theories
Crypto standards development
Slippage reduction in AMM trading
The (inevitable?) centralization of governance tokens
Check out the article to dive deeper…….
Community Takes
@tomwanhh on CEX Proof-of-Reserve [link]
@Defi_Mochi with an amazing guide for learning Dune [link]
@mhonkasalo on positive recent charts [link]
@dvdkll on DeSci & Dune [link]
@Chinchillah on stablecoin flows [link]
Now, let’s get into some data………
Network Penetration
This is a guest post by Dune Wizard @frank_maseo. Check out his Dune work here, and follow him on Twitter!
User growth. DAU. Retention. Market share.
We’re all familiar with these metrics, and rely heavily on them for our analyses. But they don’t always tell the whole story.
Today we're going to talk about another metric you can add to your analytical resume - network penetration.
What is Network Penetration?
Network Penetration measures the share of total wallets on a network that have interacted with a given protocol. It’s a good proxy to understand the total share of on-chain attention a protocol has received within its network.
How do we measure it?
It’s simple. We work out the ratio by measuring the number of wallets that interacted with a protocol versus the total amount of wallets on the network.
It’s helps us understand how much of a protocol's total addressable market it has managed to capture, and its successful relative to its potential.
What can network penetration tell us?
There are a few key ways to use network penetration to help decision making and gain practical insights.
A gauge of protocol maturity
As with startups in general, crypto projects go through several stages of growth before reaching maturity and a robust product market fit.
Uniswap’s Network penetration on Ethereum is a good example to visualize these stages.
We can see that from its genesis until DeFi Summer, network penetration hovered between 1-5% as the protocol slowly found its market. At this stage Uniswap was outpacing the growth of Ethereum itself, a good sign.
From June 2020, Uniwap’s network penetration exploded, significantly acquiring new users at a 5x higher rate than Ethereum itself.
By Summer 2021, Uniswap had become the go-to DEX, with a network penetration of >50%. It’s now an established blue chip project, yet its network penetration has been slowly declining for the past year:
As another example - let’s take a look at the DeFi/yields sector.
Ribbon Finance’s Network Penetration is at around 0.07% while Yearn Finance, one of the pioneers in the space, is over 10x higher at 0.8% (down from an ATH of 3.2% in 2020):
We can quickly see that these two protocols are at different stages of maturity.
Supporting Product Strategy
Network penetration can be a useful metric to support product decisions. For example:
Low network penetration = protocol should focus on gaining attention within the network through growth, marketing, competitive strategy
High network penetration = protocol is increasingly dependent on the growth of the network itself for user acquisition, can be a signal to shift focus to retention/ltv
For example, Uniswap’s current network penetration on Arbitrum is 42%, and 21% on Optimism.
On Arbitrum, it already topped out at >80% in late 2021 and has since dropped to 42%:
Is that a bad sign? It isn’t great, but 42% is still huge. It just means that Uniswap hasn’t been acquiring users at the same rate as Arbitrum itself, which exploded 10x in users through 2022.
We can see Arbitrum’s overall growth courtesy of this query by @springzhang:
Uniswap is past the stage of hyper growth within the network itself and now focuses more on improvements for existing users.
On Optimism on the other hand, Uniswap’s network penetration has been booming through the past few quarters, and even though it’s at >20% there may well be room for further growth:
The metric on both L2s is useful for comparison and may present a different set of challenges & opportunities.
Measuring real growth
By measuring network penetration, we can compare how a protocol’s user growth is trending relative to the growth of the network it's on. We can break down growth into two types:
Organic growth: protocol growth driven by network growth
Real protocol growth: the protocol adds more users than the network and gains more user visibility within the network
The first is a “rising tide lifts all boats” effect, while the second measures a more specific and promising kind of growth.
Let’s look at a few hypothetical examples.
Protocol growth > Network Growth: good! The protocol is gaining attention within the network and/or onboarding new users to the network.
Protocol growth = Network growth: neutral/good. The essential part of the protocol growth is organic and the protocol is benefitting from the network’s overall success.
Protocol growth < Network growth: netral/bad. The protocol is not onboarding new users as fast as the network, its share of network attention is decreasing.
Let’s use a fast growing DeFi protocol as an example - GMX on Arbitrum and Avalanche.
On Arbitrum, we can see that apart from a dramatic spike of real protocol growth in Summer, GMX’s growth is mostly organic and keeping pace with that of the network.
On Avalanche though, real protocol growth is steady as GMX consistently outpaces network growth since inception:
Context, context
As with any other metric, it is not a standalone KPI to take without context. What we’ve shared here are raw metrics, and need more analysis to fully tell their story.
Nevertheless, network penetration is a useful metric in conjunction with others such as return rate, daily active user trends and other usage-based KPIs.
Next week we’re going to publish a full article about this on our blog, so stay tuned…..
DeFi Lending & Liquidation
Lending was one of the original killer use cases for DeFi, and still is today.
Through a new dashboard by @joshua_web3, we can take a tour of the lending market on Ethereum, looking at the biggest players in turn.
The dashboard looks at 4 platforms:
MakerDAO
Aave
Compound
IronBank
According to the dashboard, MakerDAO’s volume dwarfs the rest.
Maker saw almost $1.2b in volume over the past week alone. It’s followed by Aave, Compound, and IronBank at a distant fourth:
At the end of last year MakerDAO was accounting for >90% of combined transaction volume.
By Q2 though Aave was growing fast and Maker’s share was down to 20% of the total some weeks. Though Maker regained ground through Summer, Aave’s share has been >50% of the market as recently as early November:
When it comes to users, things also look a little different. Aave has had almost 10x more users than Maker over the past year, followed by Compound in third place:
Let’s take a quick look at a related topic - liquidations - through a great new dashboard by @KARTOD.
November was a big month for liquidations, with over $70m liquidated on Aave alone over the past 30 days:
70% of this - $58.3m - was $CRV.
It all went down on November 22nd, as the infamous Mango Markets attacker attempted to profit from crashing $CRV’s price. Something of a short squeeze developed, and the whale ended up liquidated.
Over $41.3m was liquidated in a single hour, and millions more in the hours following:
The dashboard also has an interesting chart tracking liquidations alongside the price of $BTC. We can see they are unsurprisingly well correlated:
There’s a lot more in this dashboard, which is super comprehensive. Check it out.
Take a look at @joshua_web3’s Lending dashboard too!
Uniswap NFTs
This week Uniswap officially launched their NFT integration, promising users the best prices and the ability to seamlessly trade across major marketplaces like OpenSea, X2Y2 & many more.
A new dashboard by @Marcov tracks the action so far, let’s take a look.
Uniswap is a big name, with big reach. In just a few days, there has already been over $425k in volume:
There have been 981 total transactions by 769 buyers and 1.4k sellers.
Though OpenSea has been the most popular marketplace - X2Y2, Sudoswap, NFTX, and others have seen dozens of transactions:
As part of the launch, Uniswap are offering a gas rebate promotion until December 14th.
A dashboard by @pandajackson42 covers the rebate, which is being offered on the first transaction to the first 22k addresses that use the new platform.
766 addresses are now eligible to claim a total rebate of 3.25 $ETH.
For another marketing initiative, Uniswap are also airdropping almost $4.9m in $USDC to historic Genie users.
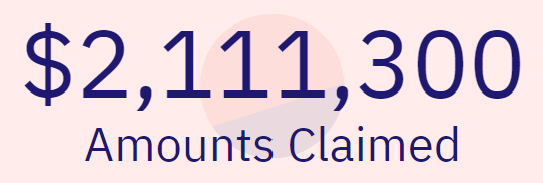
According to another dashboard by @pandajackson42 - 6800 addresses have so far claimed over $2m:
That’s around 43% of the total amount up for grabs. There’s a year to claim still, and if you used Genie before April there’s a good chance you’re eligible.
It’s interesting to see the world of ERC-20 and ERC-721 tokens colliding in recent months as the line between them blurs through NFT financialization and moves like this from Uniswap.
With their strong brand & large userbase they are well positioned to become a major player in NFTs just as they are in DeFi.
Check out these dashboards to learn more:
DAO Tools
The way to succeed in Web2 was often to become a “shovel provider” and enable others to build and innovate, so why not in Web3 too?
We saw a range of tools popping up that supported the creation & management of different kinds of DAOs. How successful were they, and how are they doing now?
Let’s find out through a dashboard by @Henrystats…..
The dashboard tracks 5 DAO tools:
Syndicate
Colony
DAO Haus
Aragon
Zodiac
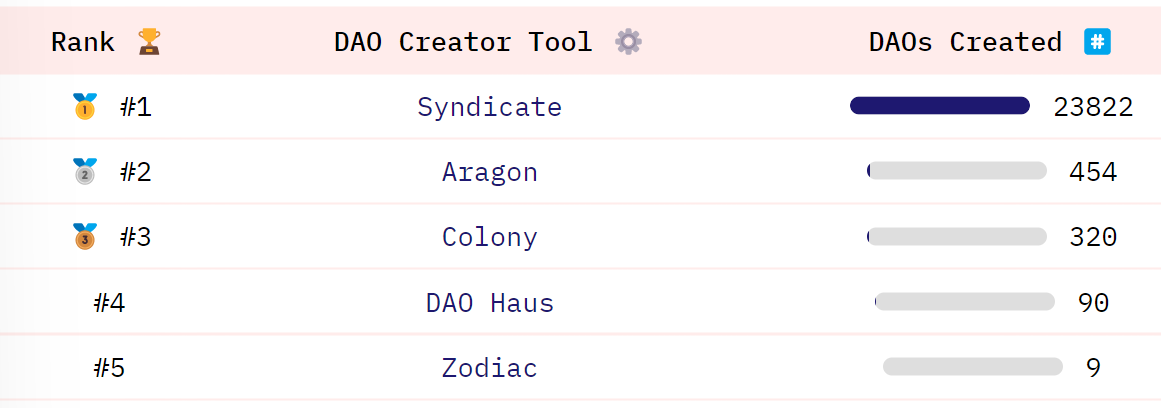
Immediately we can see that one of these is far bigger than the rest - Syndicate - a tool that allows users to easily spin up their own “investment club”.
Syndicate boomed after the wider markets had already taken a turn in June, quickly reaching heights beyond other tools with thousands of DAOs created:
Almost 24k DAOs have been created with Syndicate over the past quarter.
Aragon has been the second most popular with 450+ DAOs created, followed by Colony (320), DAO Haus (90) & Zodiac (9):
Syndicate is something of a special case here, and has seen great adoption in spite of the wider market conditions.
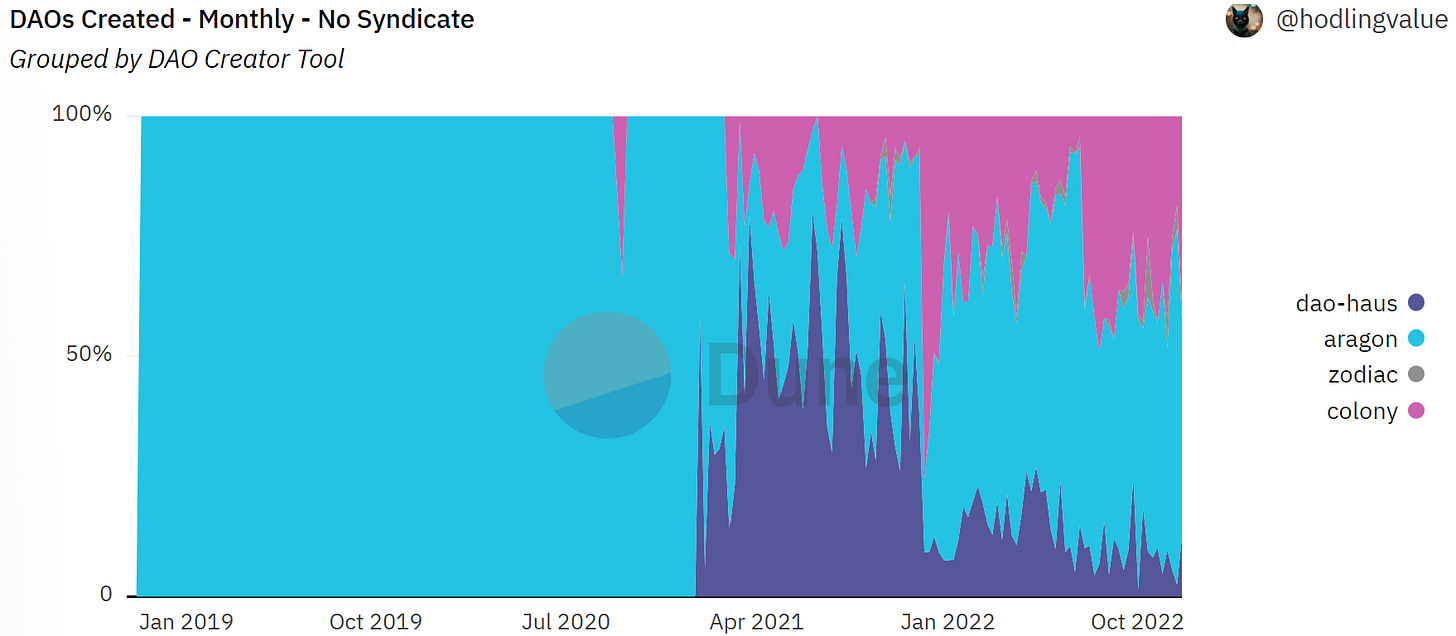
Another dashboard by @hodlingvalue looks at the market without Syndicate, and has some interesting stats.
Overall there was DAO mania at the end of 2021, with hundreds created every week. This dropped in 2022, but seems to have continued at a steady rate above the previous year’s average:
Aragon was the first on the scene in 2019 & 2020. As the DAO model was popularized in 2021 though they lost market share to Dao Haus & Colony.
Through 2022 Aragon has somewhat regained its position while DAO Haus slowly lost ground and Colony grew steadily:
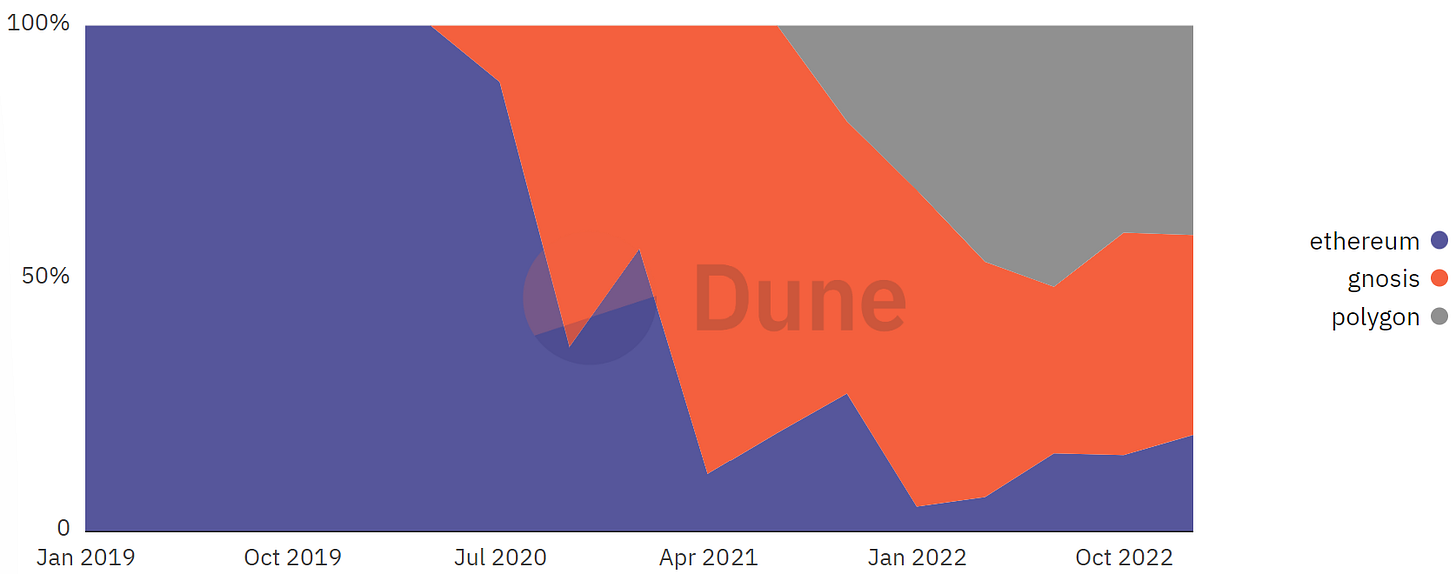
DAOs also started off as a purely Ethereum thing, but that’s not the case anymore.
Gnosis became a popular network to launch on since late 2020, and over the past year Polygon has become one of the go-tos:
Overall, Syndicate seems to have hit on a solid model - but the larger DAO tooling market is lagging recently with very few DAOs active.
It’s often argued that bear markets are the time when real innovation & new models emerge, so this space is an interesting one to watch and see how it develops.
Check out the full dashboards for more:
Bitcoin on Avalanche
Last week we covered Bitcoin on Ethereum, but that isn’t the only network holders are putting their $BTC to work on…..
BTCb represents Bitcoin on the Avalanche network. It’s similar to $wBTC in that it’s an ERC-20 token on Avalanche’s c-chain pegged to the value of $BTC.
The creation of $BTCb is handled entirely through the Avalanche Bridge and the dedicated Core browser extension. When the holder wants their $BTC back, they can simply “unwrap” the $BTCb and receive the equivalent in their Bitcoin wallet.
Let’s investigate through a new dashboard by @gfkacid.
Though Bitcoin has been leveraged on Ethereum for over 2 years, $BTCb only kicked off this June.
Supply grew fast through late Summer but dropped and plateaued in late September. In Q4 though there was another boom, with 1800 $BTC finding their way onto Avalanche over a 6 week period.
This plummeted in the week following the FTX blowup, but has climbed again over the past week:
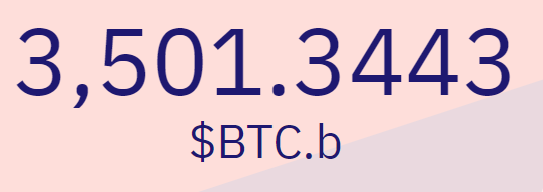
There are currently over 3500 $BTCb in circulation, worth around $60m in today’s prices:
It’s interesting that the $BTC on Avalanche is increasing while the $BTC on Ethereum has been steadily falling for months. Perhaps some holders see new opportunities there?
Check out the full dashboard for more.
More Dashboards
GN
Whew that was a long one.
Thanks for reading - and as ever a special thanks to all the Wizards for their contributions.
Have a great weekend and see you next Friday.





Hello friends