

Dune Digest #51
XEN, $USDT vs $USDC, FraxLend & More!

GM
Welcome to Issue #51 of Dune Digest!
Firstly, we’ve got some exciting news for all you NFT-focused Wizards.
NFT Spells on V2!
We’ve migrated & implemented NFT spells (previously known as abstractions) to Dune Engine V2 after a significant redesign.
You can now make use of mints/events/burns/fees as well as trades. Spells are now cross-chain, and the data is more robust.
This opens up some powerful new use cases like cross-chain NFT dashboards. Enjoy!
L2 Deep Dive with @mslib7
In this week’s Dune Arcana, @agaperste was joined by OG Wizard and Optimism oracle @mslib7 for a deep dive into Layer 2.
It was a really educational session that explained the L2 ecosystem on a deep level, all demoed through Dune queries in real-time.
If you’re up for some learning this weekend - check it out.
Now, let’s get into this week’s data…..
Xen turns ETH Deflationary 🧘
Over the weekend Ethereum became temporarily deflationary thanks to XEN, which claims to be a “universal cryptocurrency” committed to crypto’s core values.
Xen, which has no initial supply or cap, is based on a “proof of participation” system.
Coins are “mined” by users who initially prove participation and receive a cRank, basically a measure of how early they were, that determines the size of your potential claim.
Claim size is relative to the “term” you choose to lock the tokens for, a period of anywhere from 1 to 100+ days after which you can claim and then stake, hold or dump at your pleasure.
The tokenomics are rather arcane, and the above description is simplified. But along with the help of a new dashboard by team @sixdegree, we can get a good idea of what has happened so far…..
Claiming was essentially free, and a huge amount of wallets participated so far, over 800k:

Predictably, this used up a crazy amount of gas - 4,762.7 $ETH in under a week.
The earlier you were to claim, the better, so on the weekend and Monday there were 10k+ claims hourly.
This dropped from Tuesday onwards but remained in the 2-5k per hour range on average:

Of the 800k+ who claimed, 256k have minted a total of 22.26B $XEN. That’s around 32% of the total claimed.
Over 59% opted for a 1-3 day term. Many seem to have a higher conviction though, with 114k choosing a term of 360-1000 days, and hundreds of thousands locking for a month to a year.

There was a brief point on Monday when $XEN’s price topped $1.
Token price has crashed since though to $0.0000818!

With the large majority of claimers dumping the token, there are now only 19.34k holders. The top 100 holders have almost 80% of the supply.
For almost 70% of wallets, this was their first transaction. Over 83% had less than 5 transactions:

It’s early days for the project, and things are looking like a mixed bag so far.
Apart from the crashing token price, Xen has also reportedly been hacked and sybil attacked already. Many are very skeptical about the whole thing and have been highlighting the project’s ponzinomic vibes.
On the other hand, the design principles are interesting, and it will make the history books for pushing $ETH into deflationary territory for the first time post-merge.
Check out the full dashboard for much more data.
USDT vs USDC - who bans the most? ❌
$USDC sparked debate in recent months for banning addresses, especially related to the OFAC sanctions against Tornado Cash.
Its big brother, $USDT, has tended to slip under the radar in recent history. A new dashboard by @subinium compares the two.
Which is more ban-happy on Ethereum though? Let’s find out.
Circle ($USDC) has banned 88 addresses in total. Of these 15, less than 20%, are “real” locked wallets with a >$0 balance.
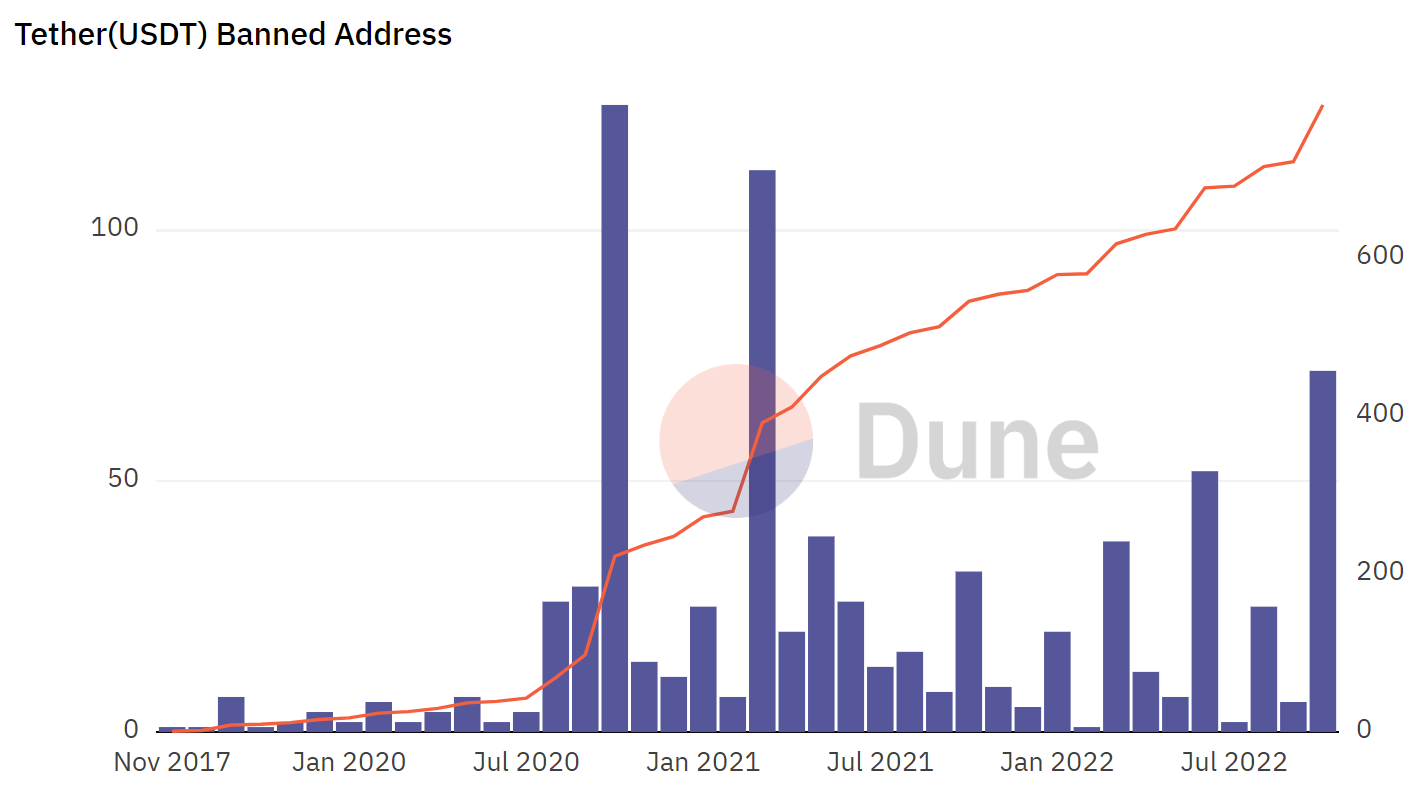
In contrast, Tether ($USDT) has banned 9x more in total:

And more than 90% of these have a nonzero balance, so Tether has actually banned over 49x more real addresses.
Tether was earlier to the game. They blocked their first Ethereum address way back in 2017, and have been going steadily since.
Note that this month has seen a 2022 high for bans, thanks to a few major hacks over the past few weeks - and we’re only half way through!
Circle started later, dishing out their first blacklist in Summer 2020 and only banning 24 addresses through the whole of 2021. They had an unprecedented banning spree in August though, banning 39 addresses mostly related to Tornado Cash.

That said, the amount frozen was relatively small - only $90k for the month of August according to the dashboard.
Over the past week though, more $USDC have been frozen than ever before - $2.7m in total!
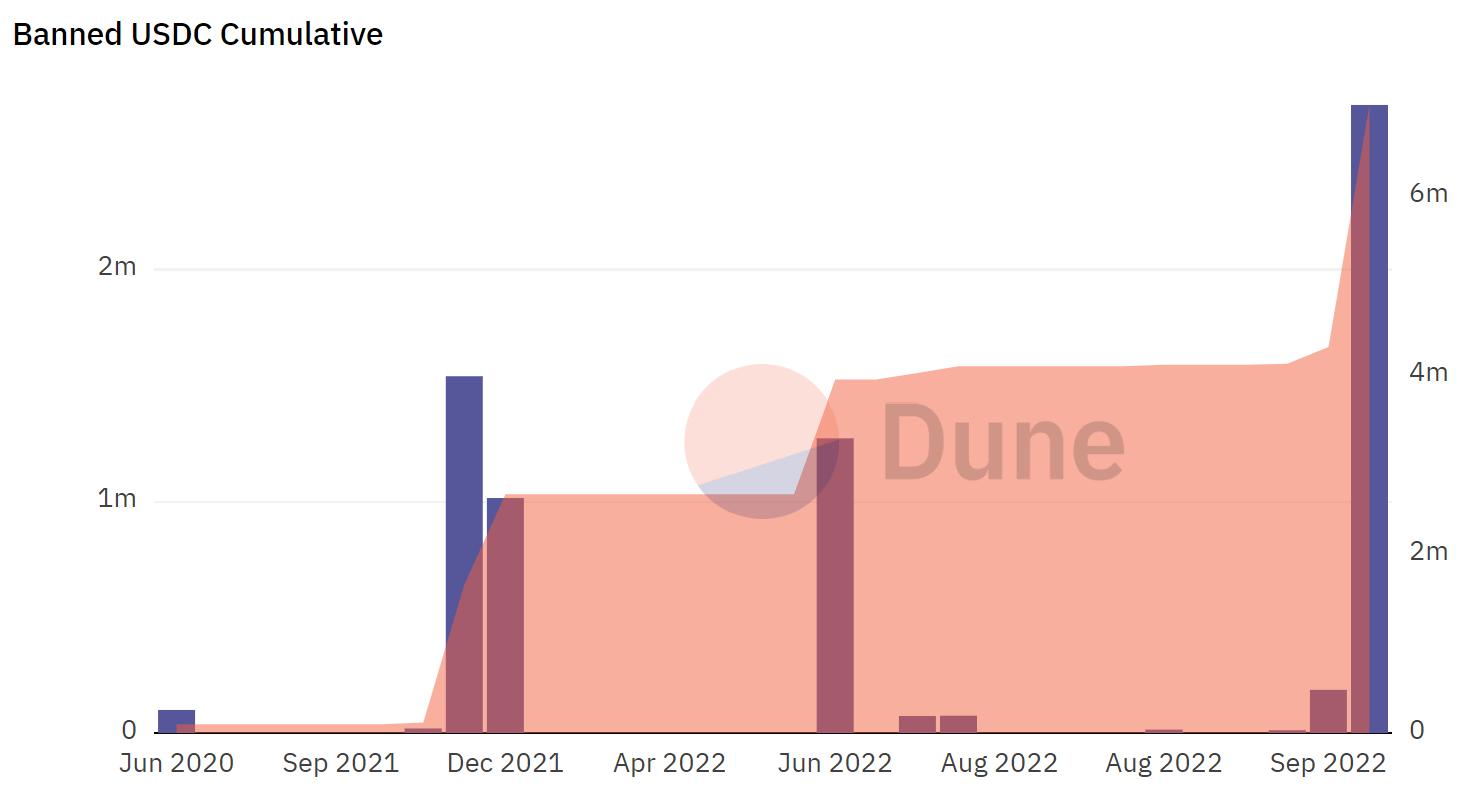
Even with these big numbers, they’re not in the same league as Tether when it comes to the totals.
Banned $USDT wallets have a whopping combined balance of $444.57 Million, 63x more than $USDC at $7.02m…..
In summary, Tether has banned far more addresses and frozen far more funds in total.
This is always a possibility with any centralized platform, and makes many question whether they really self-custody their stablecoins.
An interesting dashboard covering an important topic, check it out for more data.
FRAXlend 💰
Throughout 2022 Frax has been growing fast.
It’s now the dominant algorithmic stable by TVL, and is known for pushing the frontiers of stablecoin design.
Recently they launched Fraxlend, a new lending platform for overcollateralized loans.
Fraxlend allows users to create permissionless “pairs” of ERC-20 tokens, isolated markets where borrowers deposit a specific collateral token to borrow another.
Let’s take a look into the platform through a new dashboard by @blockworks_research…..
The protocol is less than a week old. Already though, collateral and borrow volume have been growing nicely:

35 borrowers have put up over $2m in collateral so far, to borrow almost 966.69k $FRAX out of a total 5.44 Million supplied to the protocol.
5 pairs have been created so far - with $WETH, $WBTC, $FXS, $CVX & $CRV as collateral.
The deepest pairs so far are $WBTC, followed closely by $WETH which together account for over 90% of total borrow volume.
Taking the deepest pair - $WBTC - as an example, we can see that the largest borrower will be liquidated if the asset falls to $15,044:

But the major loans are all at a healthy LTV so far:

It’s an interesting play by Frax, who also plan to soon add new features like custom term sheets, allowing parties to negotiate individual loans.
This dashboard is ideal for tracking the project, check it out.
Into the Metaverse 🥽
Many are betting big on the concept of the Metaverse.
Citi predicted that it could reach $13 Trillion by 2030, and McKinsey threw out $5t. Are they right?
@21shares_research just released a new dashboard tracking these big players, so let’s take a quick look.
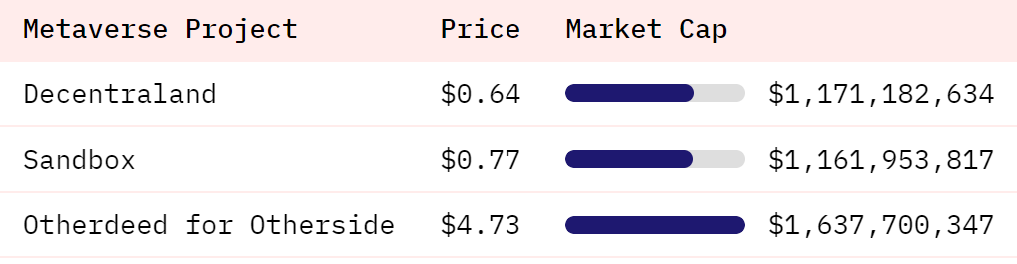
The top 3 metaverse projects by market cap are:
Otherdeed by Otherside (APE)
Decentraland (MANA)
Sandbox (SAND)
The metaverse was small in 2020, but grew sharply in late 2021 to reach a peak of around $17b in market cap. This has dropped in line with everything else, down to $5b:
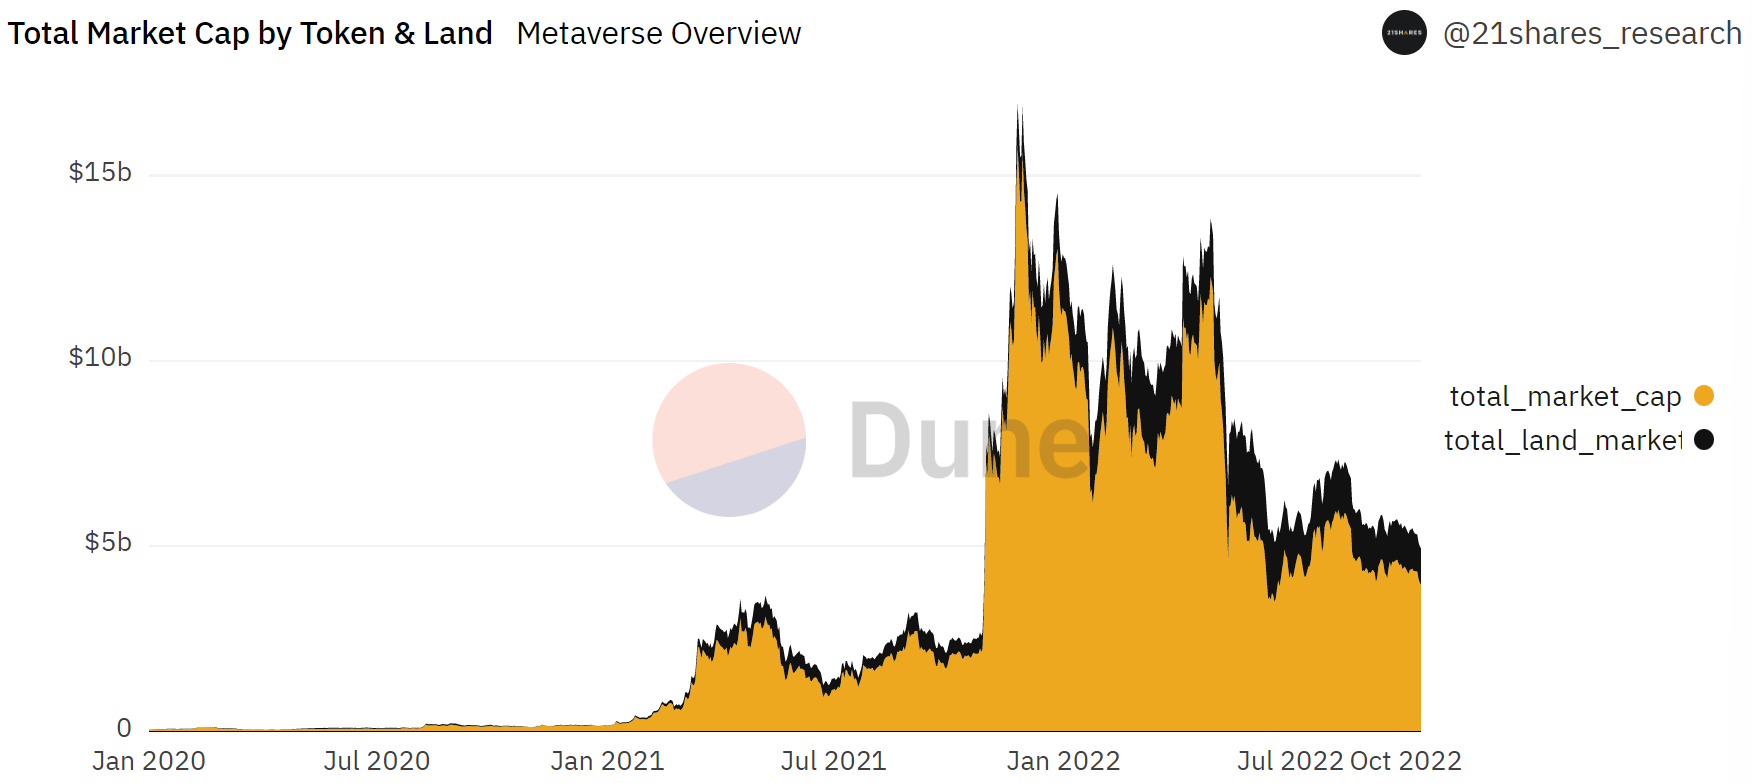
Otherdeed is the leader by market cap, thanks to its much higher token price, with Decentraland & Sandbox almost tied for second place:
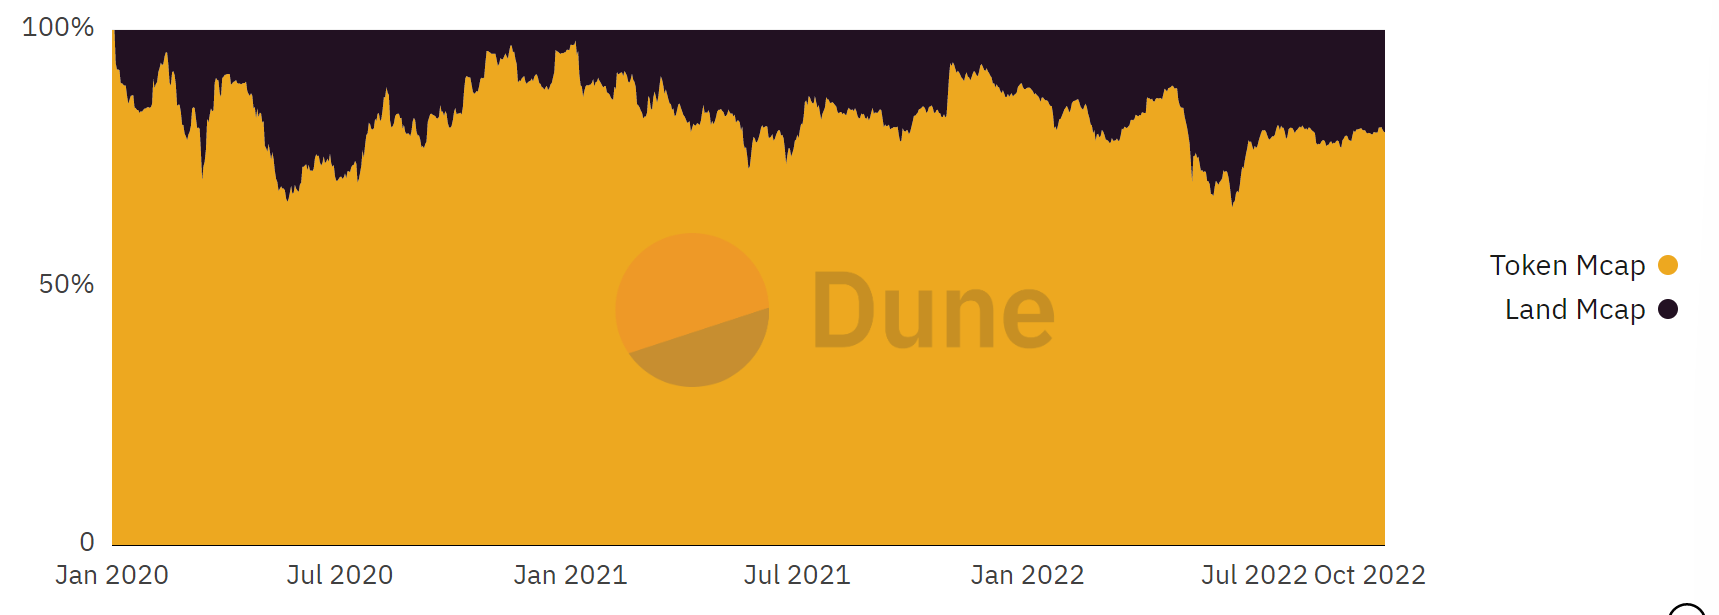
The market cap of these projects has two parts, the token and land - pieces of “digital real estate” in the form of NFTs.
Right now land makes up around 20% of the total:
The price of metaverse land has had a volatile history. It was on a steady decline through early 2022 but shot up in May - along with traders and volume - thanks to the Otherdeed launch.
In $ETH terms, it’s maintaining value relatively well:

Token prices on the other hand are down bad in $ terms, with APE leading the pack and the other 2 failing to break a Dollar in recent history:

Will the metaverse fulfill the expectations of its believers? It’s hard to say, but this dashboard is a great place to research and make up your own mind.
Optimism NFT Bridge 🌉
We’ve covered NFTs on Optimism a few times in Dune Digest, as well as Quix (formerly Quixotic), the largest NFT marketplace on the platform.
This week they launched an NFT bridge from Ethereum, which will allow users to trade Ethereum NFTs on Optimism, taking advantage of the massive time & gas efficiencies of the platform.
@chuxin built a dashboard tracking things, let’s take a look.
77 users have bridged 140 NFTs so far:

This took an average of 10 minutes & cost $4.70 in gas. NFTs from 34 collections were bridged.
When you look at the tiny % of the total collection bridged to L2 so far you can see the room for potential growth:

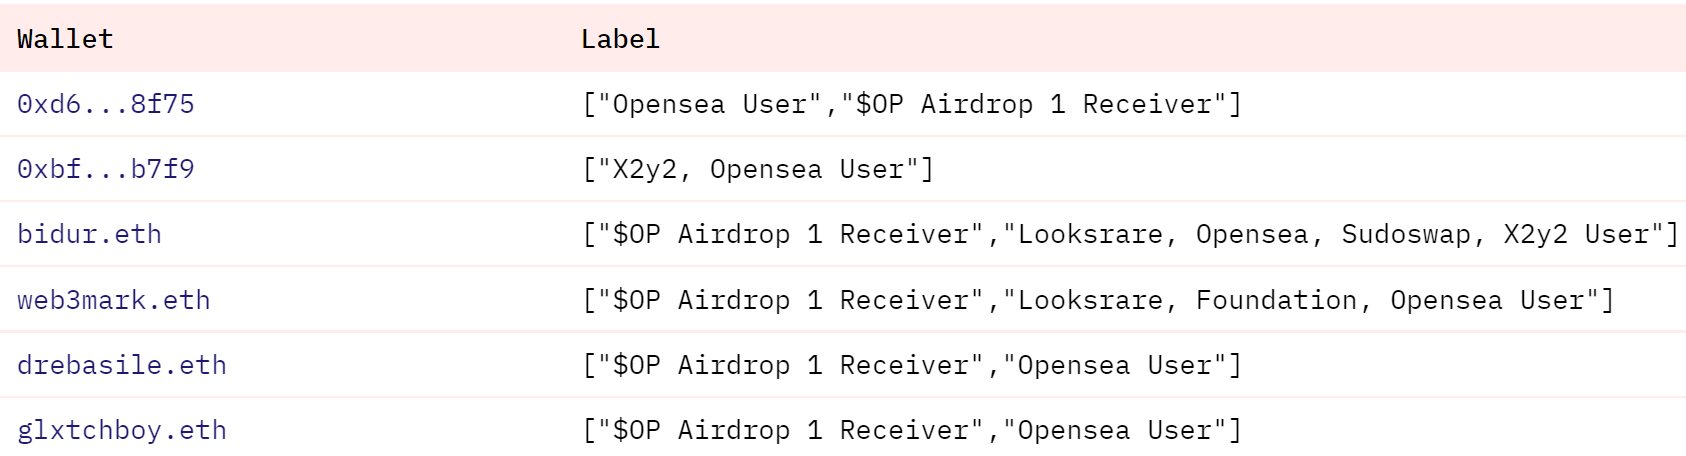
It seems that experienced power users of NFT marketplaces and L2s have been testing out the bridge so far, with many being multiple airdrop recipients and users of several NFT marketplaces:
If you’re thinking of bridging any of your NFTs over to L2, or you want to understand the protocol better - check out the full dashboard for more.
More Dashboards
GN
Thanks for joining us for another week of data, dashboards & wizardry.
A special thanks to all the Wizards featured for your great work this week.
Have a great weekend, see you next Friday.