Dune Digest #50
DEX Aggregators, Sudoswap, BNB Hack & More!
GM
Welcome to issue #50 of Dune Digest! We have some juicy data for you as always. Firstly though, some news.
New Features
We’ve shipped some new features over the past few weeks that you’re gonna love.
1/ Bubble Charts
Wizards now have a whole new way to visualize data, you’ll likely be seeing it in action in future issues….
Example:
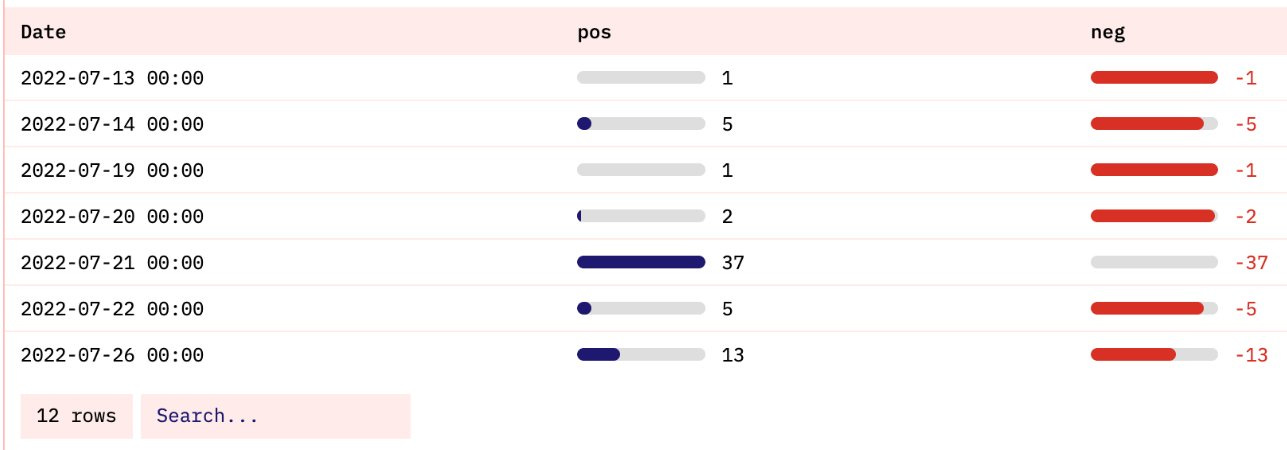
2/ Inline Progress Bars
Another viz tool that will be helpful for tracking balances and much more.
Example:
3/ Text Field Dynamic Resizing
This will improve UX for people browsing dashboards on different screens - no more messy cutoffs when you’re trying to read!
Now let’s hear some takes from our community this week.
Community Takes
@kit_kwan compares transaction volume across major chains [link]
@lido share a weekly update [link]
@tomwanhh gives juicy insights into 3AC’s recent NFT activity [link]
Evan Kim breaks down MEV bot behavior on Olympus Pol [link]
@_HariB_ talks NFT insights from Reservoir data on Dune [link]
Now let’s get into the data…..
🦄 DEX Aggregators & Uniswap
In his recent talk at DuneCon, Richard Chen argued that aggregators are overrated and losing their usefulness in increasingly consolidated markets.
For now though, they’re still big business according to a recent dashboard by @murathan which analyzes the DEX aggregator space and its impact on Uniswap. Let’s take a look…..
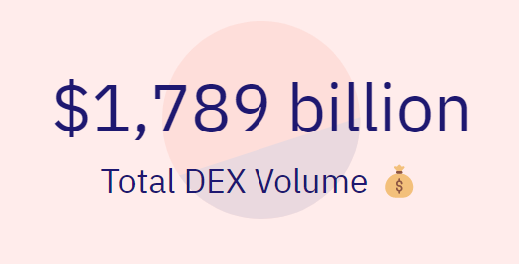
When we talk about aggregators’ place in the DEX ecosystem, it’s good to be reminded of the sheer scale of overall DEX volume, almost $1.8 Trillion in its short history:
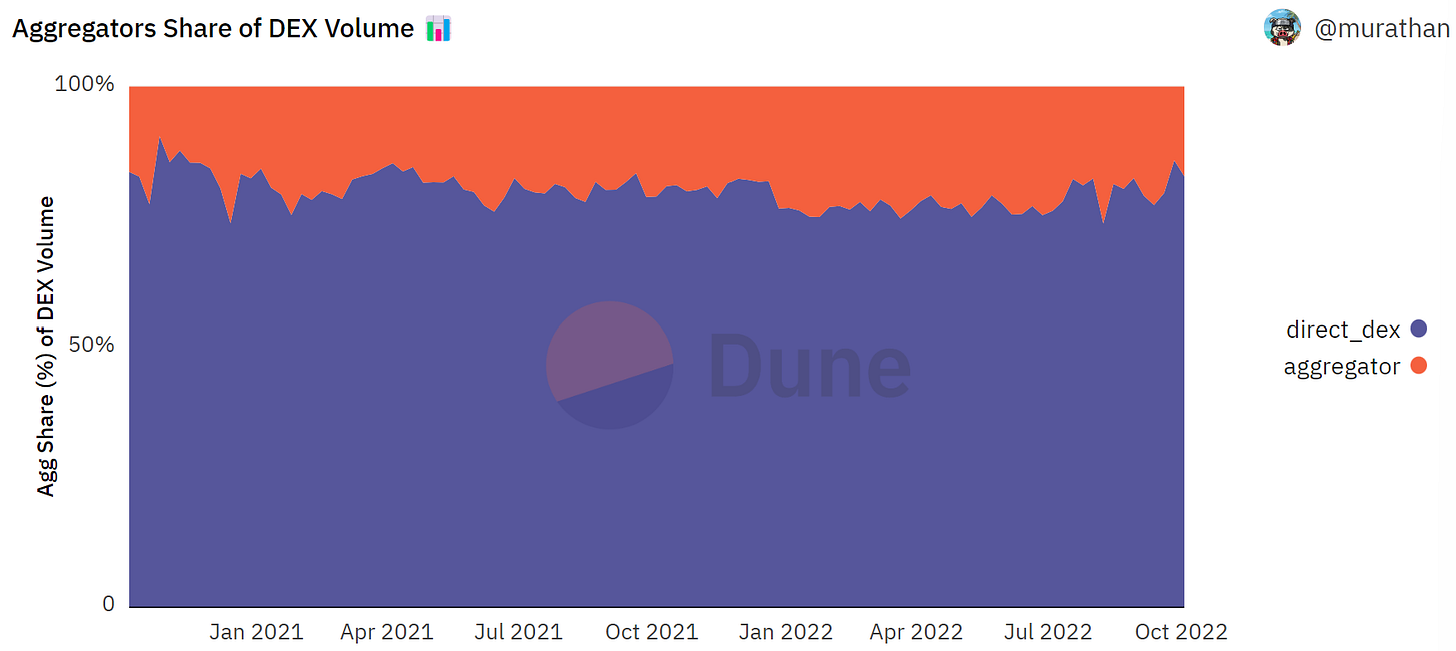
Aggregators have accounted for 20.5% of that, $368 Billion in total, with a reasonably stable market share over time:
Uniswap is still the king of DEXes, driving over $1.1 Billion of the total volume alone.
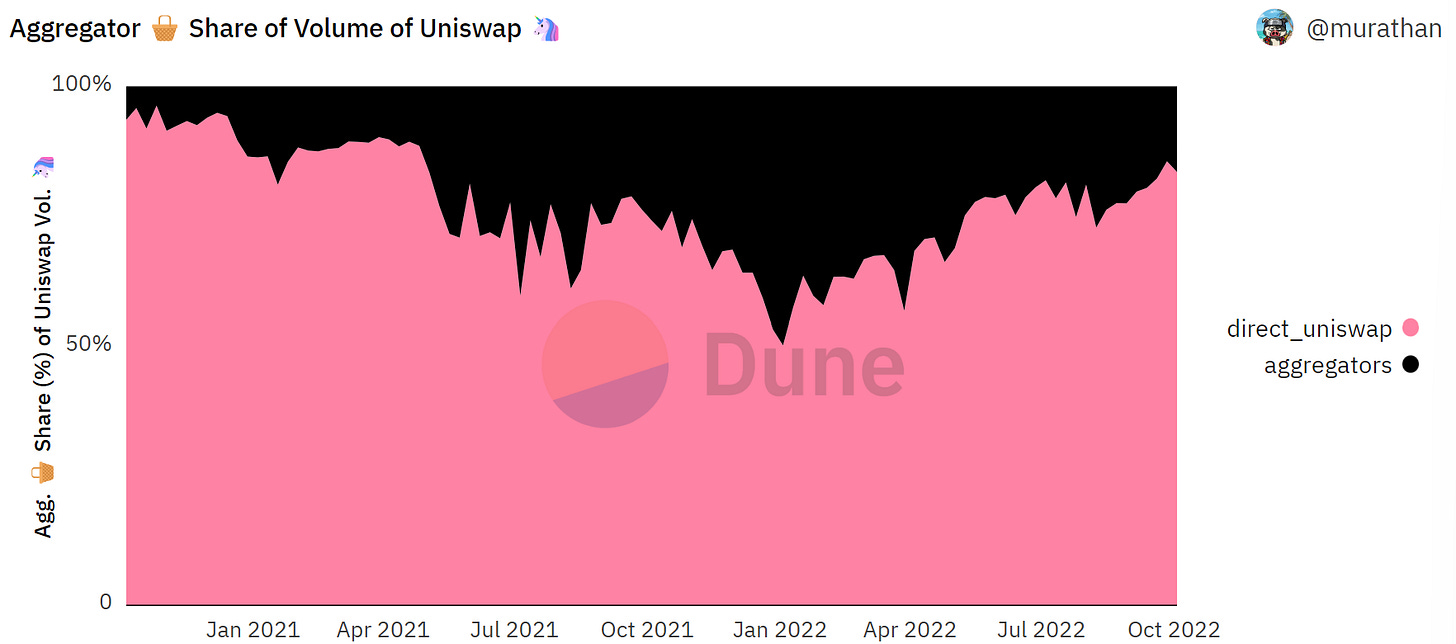
At the end of 2020, only 5-10% of Uniswap volume was facilitated through aggregators.
This really grew throughout 2021 as the bull market sucked in countless new DeFi users who appreciated the convenience of aggregators.
It peaked in 2022 though and has declined during the bear market:
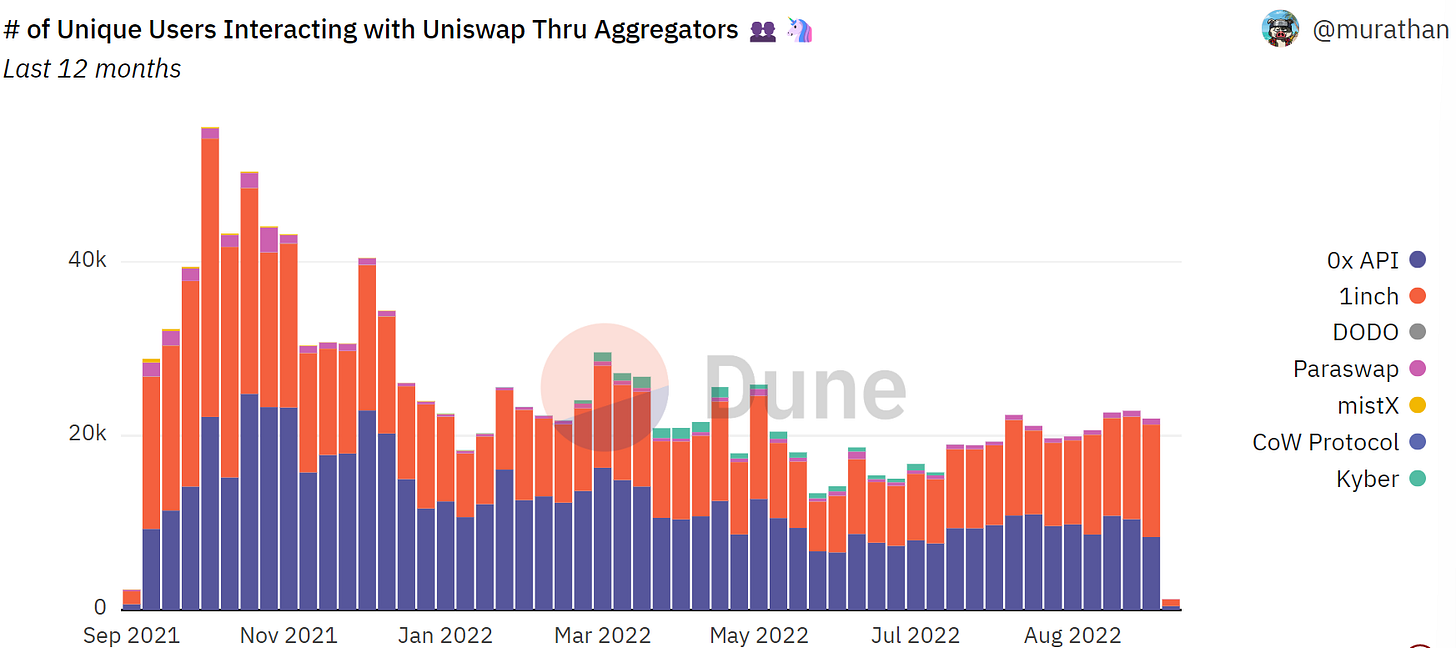
Uniswap has served over 5.3 Million unique users.
Almost 2 Million of those have come via aggregators. Weekly aggregator users have remained relatively stable through the bear market and we can even see a moderate uptake over the past few months:
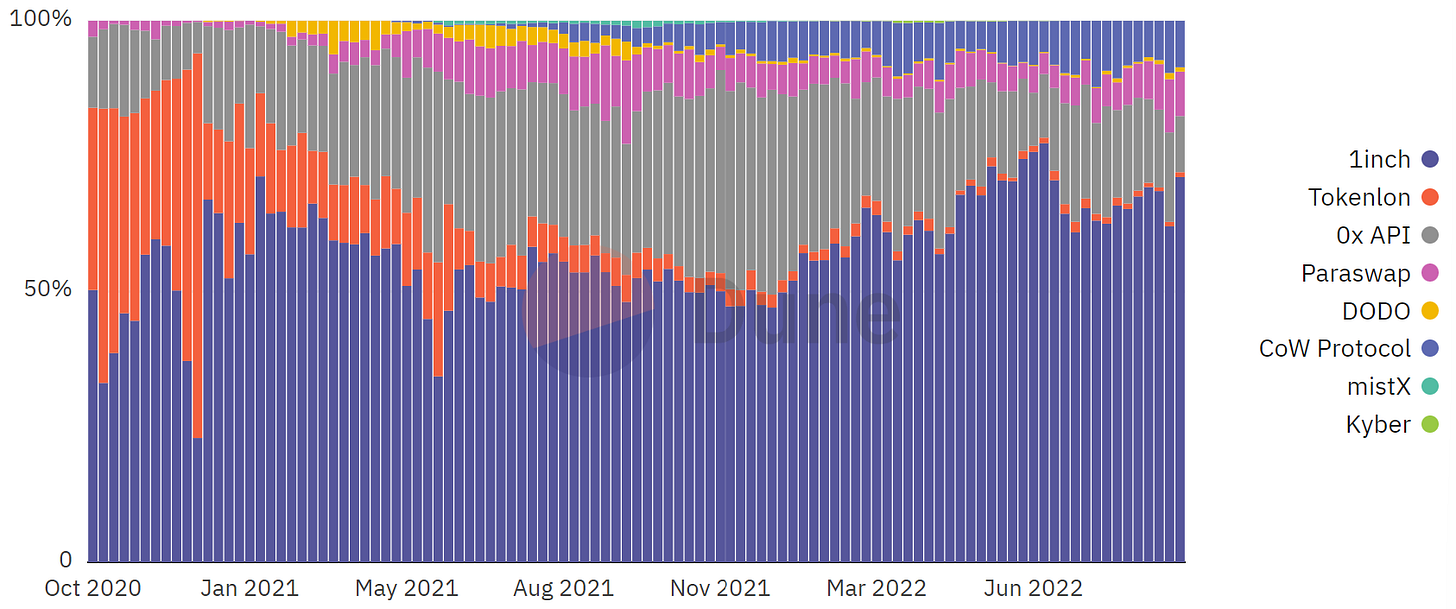
When it comes to aggregators themselves, 1inch is the clear market leader, capturing 56% of the market, followed by 0x API at 25%.
The competitive landscape has shifted considerably over the past 2 years.
Tokenlon saw its market share disappear, 0x API has been up and down, and newcomers like CoW Protocol have muscled in on the action with innovative new products.
1inch has stayed strong though, steadily growing its slice throughout 2022:
This is in the context of a huge boom in overall aggregator volume in line with DEX volume in general.
Back in mid 2020, aggregators were doing <$1 Billion in weekly volume, but a year later this had grown 5x:
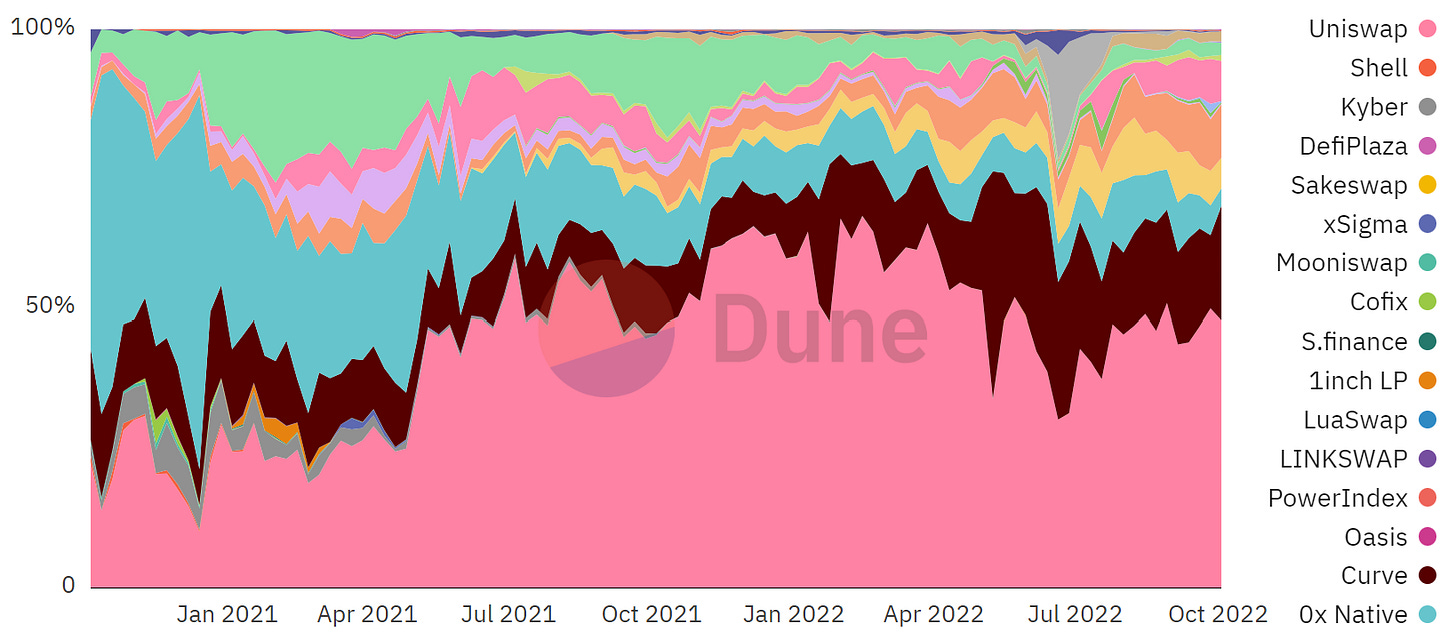
And aggregators love Uniswap, as you can imagine.
Back in 2020 Uniswap was competing with 0x Native, Sushi and others for their favor. In mid 2021 though Uni really started to dominate - consistently processing 50-60%+ of their volume.
That said, Uniswap peaked as an aggregator liquidity source early this year. Curve and others have been growing their share since:
Overall, we can see that aggregators are firmly established as an important part of the DEX landscape.
Competition for liquidity and users is fierce, and new platforms are launching all the time with attractive new value propositions.
Aggregators also seem to be key for onboarding new DeFi users, and we can expect to see them boom along with the overall space in the future.
There’s much more in this dashboard. The final section allows you to dive deep into individual aggregators and much more - check it out.
📈 Sudoswap - the #3 NFT Marketplace?
Sudoswap burst onto the illiquid JPEG scene a few months back with the promise of bringing decentralized liquidity pools to the NFT marketplace space.
This is an interesting innovation, radically different to the traditional order-book model used by market leaders like OpenSea.
Several months on, how are they doing? We can take a look through an excellent new dashboard by @jhackworth.
Sudoswap started seeing real growth in early August, peaking later that month with $2.3m in a single day. Daily volume declined noticeably through September, rarely exceeding $1m daily, but still appears robust:
Total volume is approaching $60m, and lately around 70% of volume has been driven by buyers:
How about collections?
At its August peak, 200+ collections were traded daily on the platform. This declined to the 80-120 range over the past month.
One way that Sudoswap courted users was through an attractive fee model.
The platform itself only takes a 0.5% fee on trades, far less than most competitors. Sudoswap also does away with royalties, somewhat controversially.
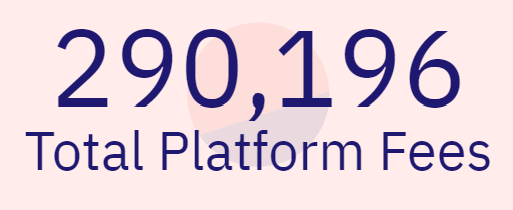
Total platform fees are shy of $300k:
There are also pool fees to consider though, which are set by liquidity providers themselves. So far these have raked in far more than the platform itself:
The NFT marketplace space is hyper-competitive and at least arguably zero-sum.
Sudoswap is competing with giants like OpenSea, X2Y2 and LooksRare - and at a glance looks far behind.
However, as @jhackworth points out:
“Sudoswap has less than 5% of its daily volume as wash trading, suggesting organic volume. Opensea has some days where it has .1% and others with 10%, X2Y2 and LooksRare can attribute most of their volume to wash trading”
The vast majority of Sudoswap volume does indeed seem to be organic:
According to @jhackworth - the volume of competitors like LooksRare & X2Y2 is mostly wash trading.
OpenSea is the clear king, and X2Y2 is consolidating its position in second place. Third place is still up for grabs though - and it seems to be a race between LooksRare & Sudoswap.
If you check out the dashboard, which is very comprehensive, you’ll understand why……
🕵️ Tracking the BNB Hacker
Another week another major hack.
Today it was on the BNB chain. The attacker exploited a vulnerability in the chain’s, you guessed it, cross-chain bridge…..
The attacker was initially able to steal a total of 2 Million $BNB, worth $586 Million.
Binance took the rare measure of pausing the chain though as the attacker scrambled to transfer funds out, so in the end they “only” made off with $133.58 Million.
We can see how they pulled it off through a dashboard by @shogun.
The hacker only paid a little over $37k in bridge fees:
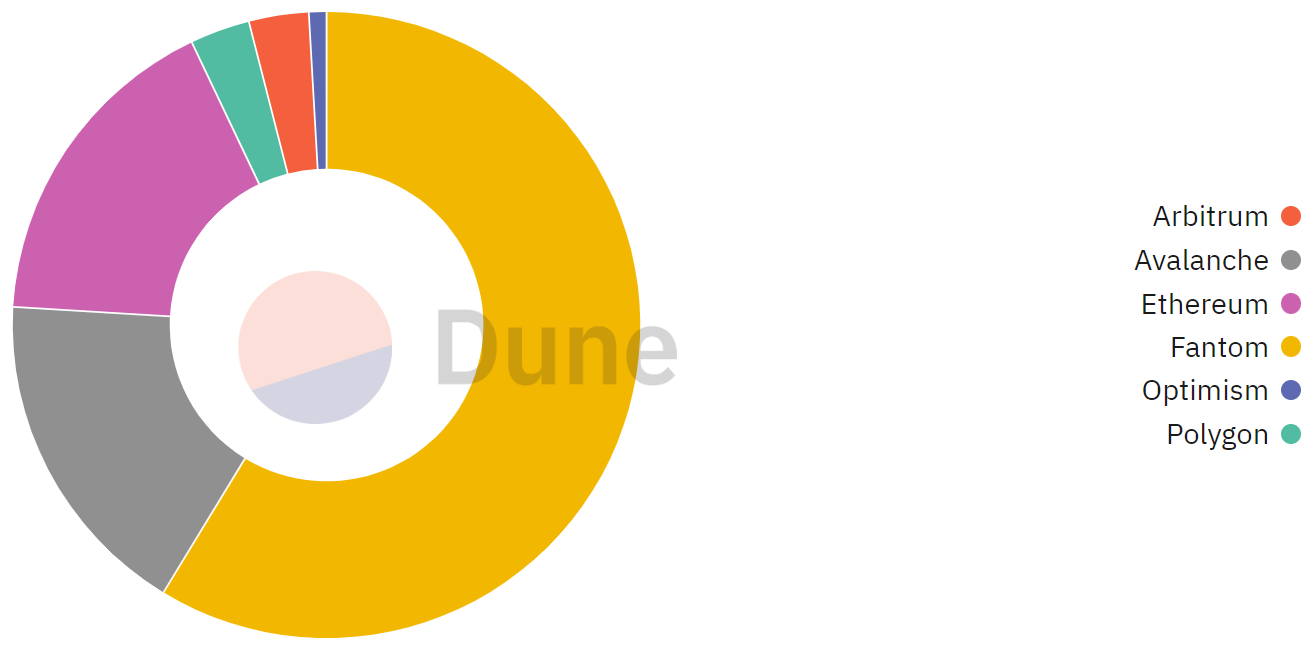
And favored Fantom as a getaway chain, bridging over $78.6m to the network. 23 and 22.7 Million went to Avalanche and Ethereum respectively, and around $9m was sent to Polygon, Arbitrum & Optimism.
The hacker made 46 bridging transactions in total, mostly ranging from $1-4m.
They used Anyswap ($74m), and Stargate Bridge ($50.5m) to escape the BNB chain.
Check out the full dashboard for more…..
🎶 Music NFTs - Sound vs Catalog
Music NFTs are an underexplored area for us here at Dune Digest.
Luckily, @pandajackson42 released a new dashboard this week comparing two of the key platforms - Catalog & Sound.xyz!
Catalog was the first on the scene, an interesting blend of streaming service & NFT marketplace. Sound.xyz followed in late 2021, raising $5m from a16z to build tools to help artists monetize through Web3.
Since then, Catalog has released 1637 editions, almost 6x more than Sound at 278:
Things are different when we turn to volume.
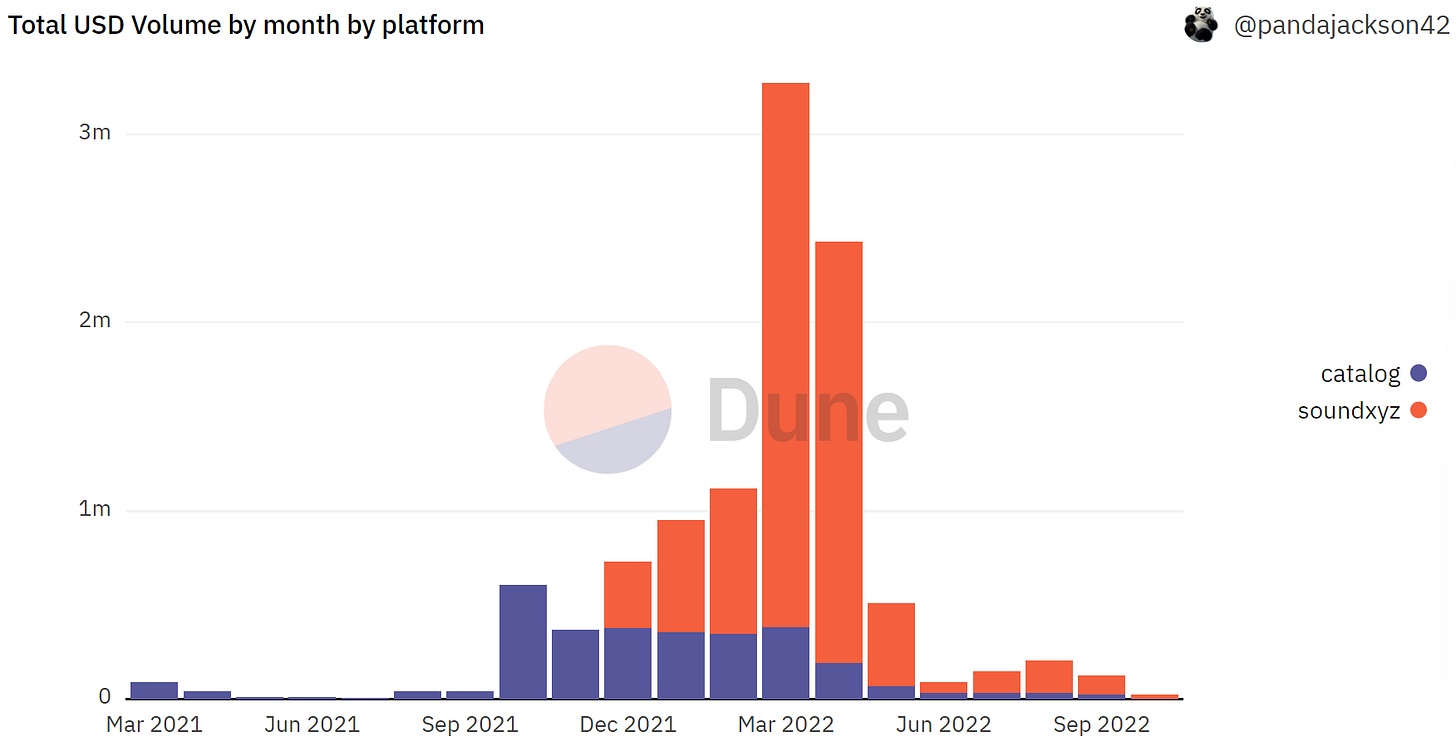
Out of a $10.8 Million combined total, $7.75m of that is Sound & just over $3m Catalog.
Volume peaked in March and April this year, and has dropped dramatically since:
It’s important to note that the vast majority of Catalog volume is primary, and you can only get their NFTs through Zora.
Sound.xyz, on the other hand, sees a significant amount of its volume through OpenSea secondary sales.
Catalog actually has a slightly higher primary volume:
The two platforms have made money for 517 artists in total, 433 on Catalog & 163 on Sound.
It seems like they provide a valuable service too.
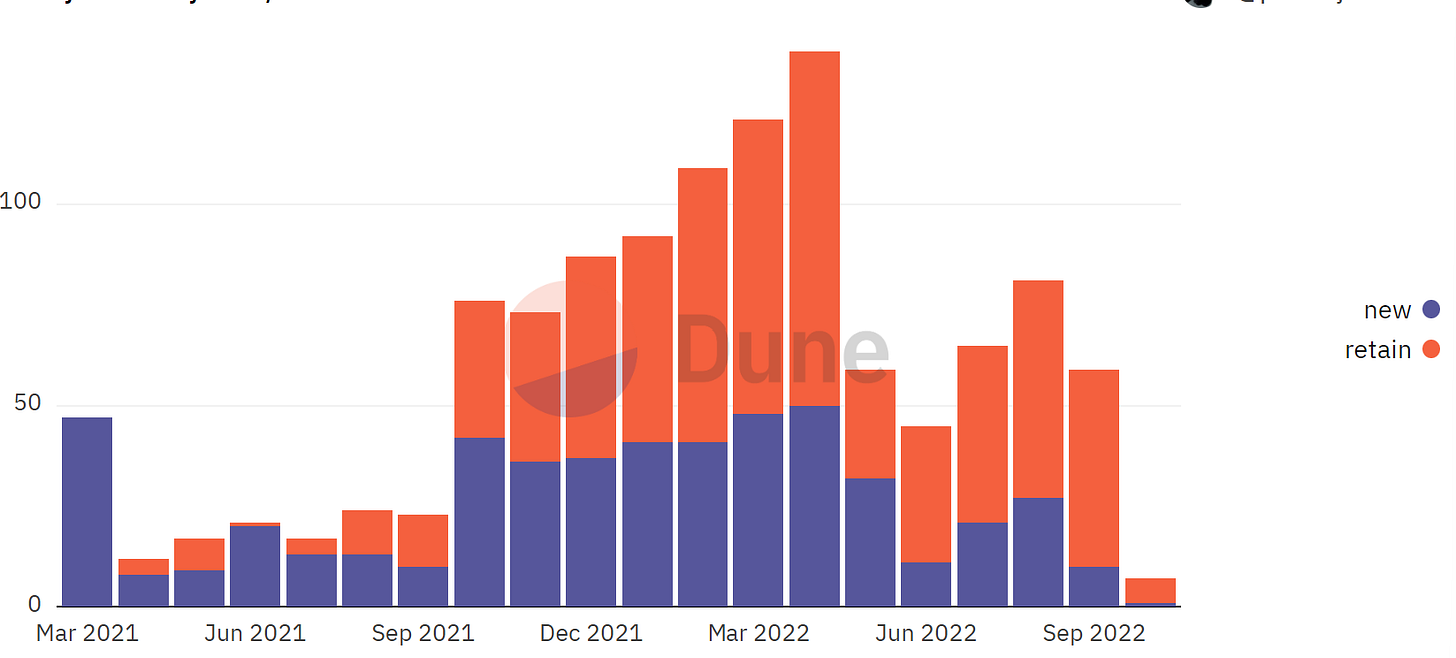
Though monthly creators have dropped, they haven’t dropped as dramatically as volume or mainstream interest in NFTs in general has.
The % of retained to new users has steadily grown:
Overall, music NFTs are still a nascent Web3 use case. They really do seem to help certain artists though, and it will be interesting to watch the evolution of the space in the coming years.
Check out the full dashboard for much more.
🦖 Linagee Resurrected
Every week in crypto there’s a new craze.
This week it was the Linagee Name Registrar, thought (by Twitter NFT archeologists) to be the oldest NFT project on Ethereum - only one week older than the chain itself.
Think about it like a very early version of ENS.
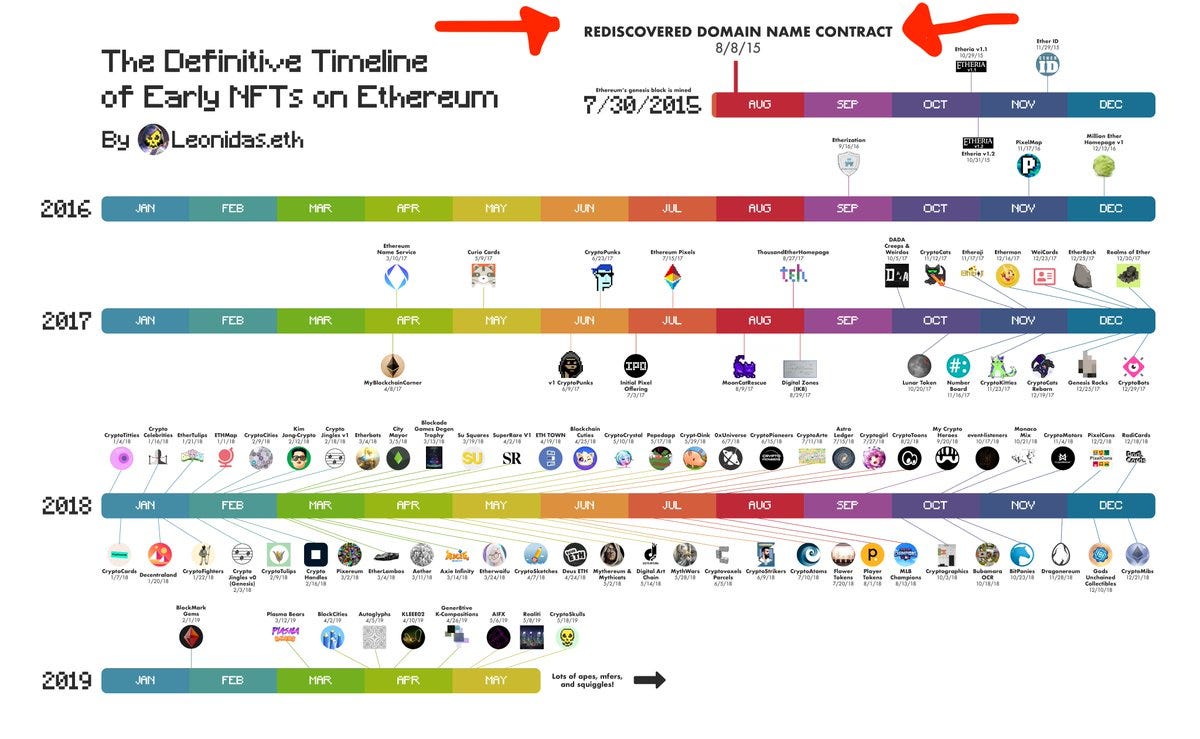
This interesting graphic by Leonidas.eth posits an early NFT timeline:
Only 60 domain names were minted on the contract back in 2015, and the project had been forgotten, as well as left inaccessible to the average Crypto Twitter denizen.
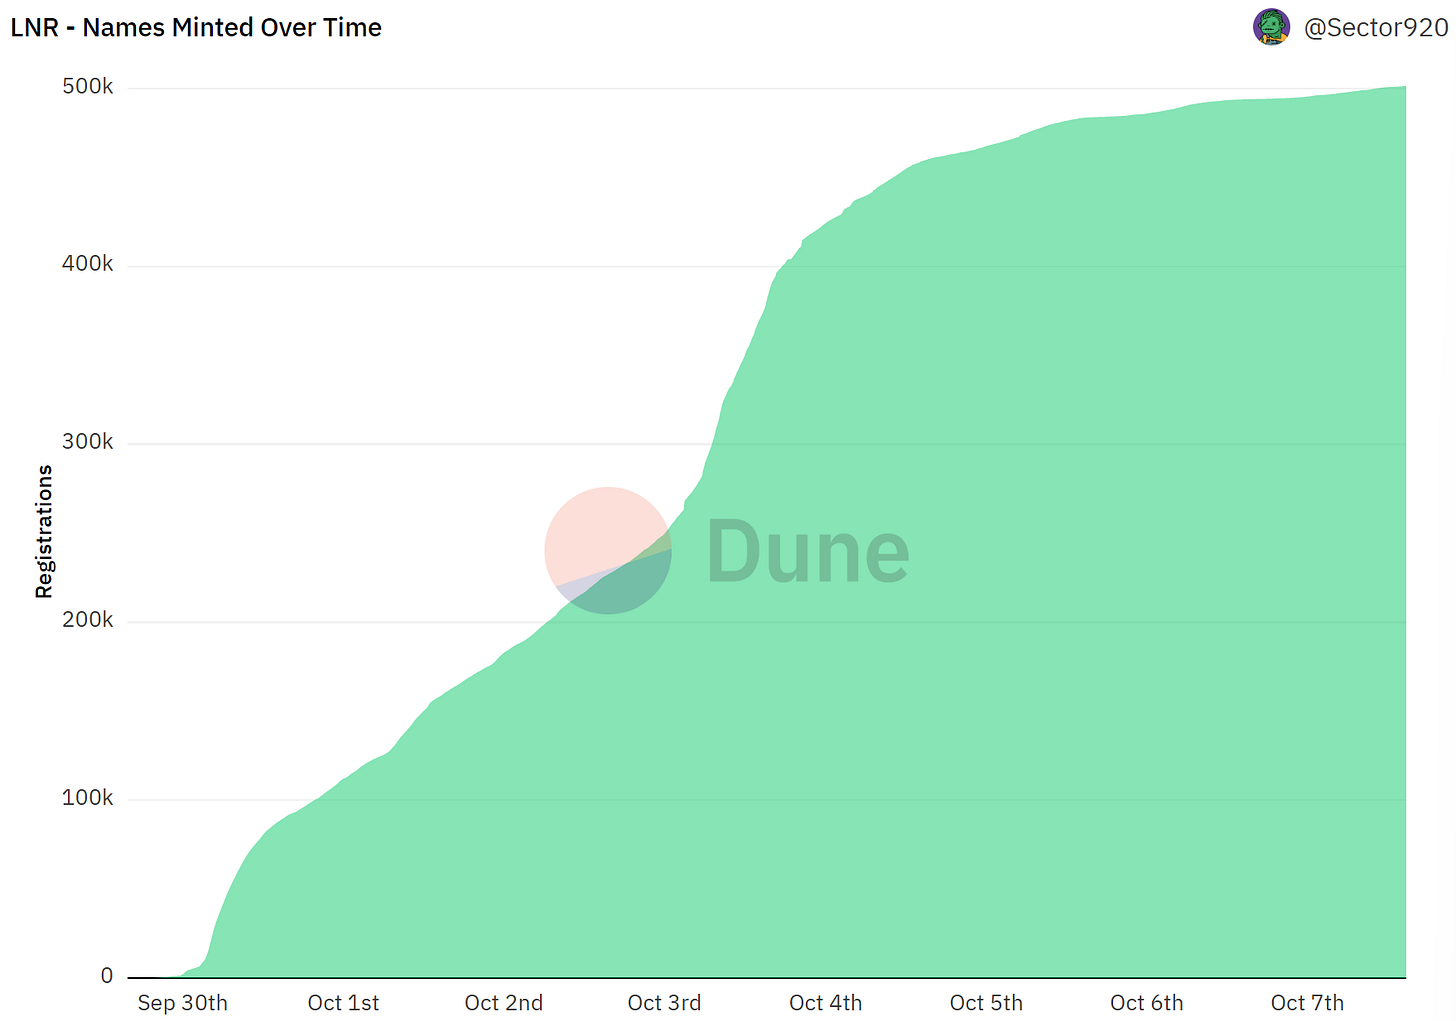
Efforts were made to bring it back to life through a minting app linking to the original contract, and that’s when things really took off - as we can see through a dashboard by @sliceanalytics…..
There was a real rush to register these names. Only a few thousand were registered last Friday, but that has shot up to 501,586!
There were 24,447 minting wallets paying an average of .0005 $ETH for registration.
7 years is a lifetime in crypto. The original contract was years before the ERC-721 token standard even existed.
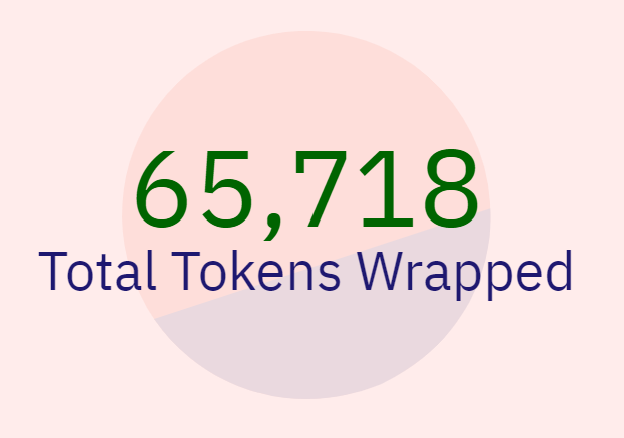
So minters who wanted to get their names onto OpenSea, other marketplaces, or even to view in their wallets, needed to “wrap” their names in a modern format.
Over 65k names have been wrapped so far:
So expect to see them on a marketplace near you some time soon. A cool little experiment, and a great dashboard. Check it out.
More Dashboards
GN
Thanks for reading, we hope you enjoyed this issue.
Of course - a special thanks to all the Wizards for their great work and insightful analysis.
See you again next week.


