Dune Digest #45
Stables, Proof-of-Stake, Mirror & More!
GM
Welcome to Issue #45 of Dune Digest!
Before we get deep into the data…..
@agasperte ran another Dune Arcana session teaching Dune tips and tricks and breaking down the BendDAO liquidity crisis. The BendDAO co-founders even joined us on the stream! Interesting stuff - check it out…..
TwigBlock has released some fantastic guided projects, taking you through your first Dune dashboard and building your Ethereum knowledge along the way. Give it a try.
Less than 2 weeks to DuneCon - we can’t wait to meet some of you there!
Community Takes
Theblumy teaches you how to research the NFT market through Dune dashboards [link]
HenryBitmodeth explores liquidity mining on Optimism [link]
1chioku investigates yield on GLP [link]
RZinovyev breaks down decentralized Stablecoins [link]
crypto_notte shares a new SLP token tool [link]
Now, let’s look at some dashboards.
Stablecoins on Ethereum
We don’t need to remind you that stablecoins are the absolute lynchpin of the current crypto space, and one of the strongest use-cases for blockchains that has so far emerged.
Two new epic stablecoin dashboards by @Kartod dropped this week:
Let’s see what new insights we can gather. The first dashboard breaks stables down into three broad categories:
Fiat-collateralized / centralized (USDT, USDC, TUSD, PAX, BUSD)
Crypto over-collateralized / decentralized (DAI, MIM, LUSD, SUSD, FEI)
Algorithmic (AMPL, UST, USDN, USDD, FRAX)
Centralized, fiat-collateralized stablecoins are by far the largest category in terms of both volume and liquidity.
Centralized stablecoin supply is over $90 Billion on Ethereum, and has grown almost 30% over the past year.
Since late 2020, all three categories have seen growth. Centralized stables saw the most though, driven in a meteoric rise by giants like Tether and Circle.
Indeed over 90% of all stablecoins are centralized & fiat-collateralized.
They also account for the most daily volume, although in the graph below you can see that the gap is slightly narrowing. Only twice have decentralized stables overtaken them in daily volume:
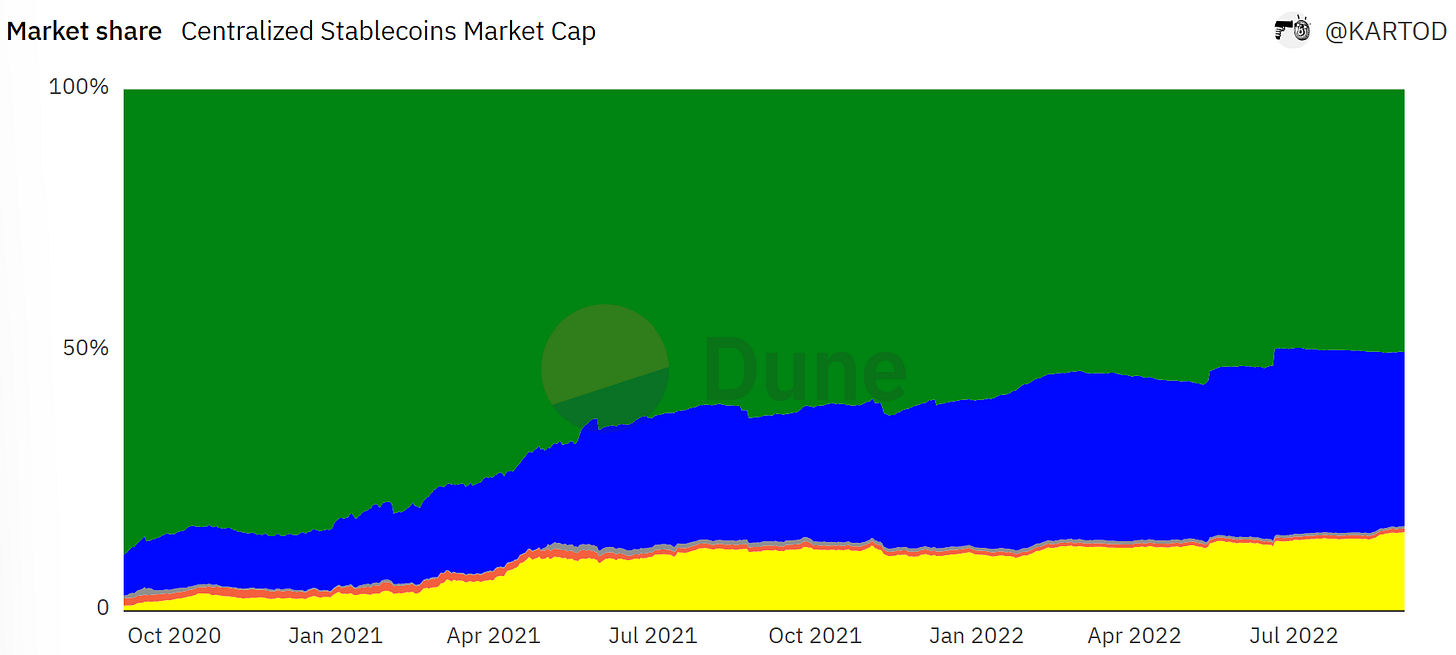
2 years ago $USDT had around 90% of total market cap, but its dominance has been gradually challenged since.
Now $USDT represents only around 50%, followed closely by $USDC at 33% and $BUSD at 15%:
When it comes to on-chain volume though $USDC is the clear leader and its dominance over $USDT in this regard seems to be growing in recent months:
Centralized stables are one of the key bedrocks of crypto and DeFi, both historically and at present.
Alternative models were around from the beginning and started to really gain ground in 2021 with the rise of overcollateralized and algorithmic stablecoins.
Overcollateralized stables are generally backed by a basket of crypto assets.
The most famous, $DAI, is backed by $ETH, $BAT, $wBTC, and other tokens. The collateral is locked in Maker Vaults and has a cumulatively greater value than all the $DAI in existence.
The total supply on Ethereum for this category is a little over $8.7b according to the dashboard:
The tokens in this category have shown the lowest supply growth over the past year at 5.6%, but have represented around 8% of the total market cap in recent months, down from 12-13% in late 2021.
When it comes to usage though, we have some interesting findings.
Earlier we mentioned that overcollateralized stables actually “flipped” their fiat-backed centralized cousins twice in terms of volume, and that the volume gap is smaller than you might think given the gap in supply.
The velocity of an asset is a measurement of the rate at which it is exchanged, calculated by dividing transaction volume by supply. Overcollateralized stables like $DAI have had the highest velocity since early 2021:
A potential hypothesis is that market participants feel more secure holding fiat-collateralized coins from large, regulated corporations in their wallets long term.
In terms of supply, the overcollateralized category is really dominated by $DAI, which has consistently been 70%+ of the total for the past 2 years and now sits at $6.5 Billion, although $MIM has emerged as a contender at 20%
$DAI is also absolutely dominant in terms of volume, regularly doing Billions daily while rivals are in the tens or hundreds of Millions.
Finally, let’s take a look at Algorithmic Stablecoins. These assets, in their purest form, are not collateralized with anything but rely on algorithmic magic and novel incentive mechanisms to maintain their pegs.
According to the dashboard, this category has the lowest total supply at a little over $2.1 Billion.
Back in 2020 AMPL & $USDN were the leaders in terms of supply. In 2021 though they quickly lost ground to the doomed UST and current market leader $FRAX, which currently accounts for 70% of supply:
Velocity for algorithmic stables was very low until late 2021 when it started to take off, and earlier this year they started to really gain traction.
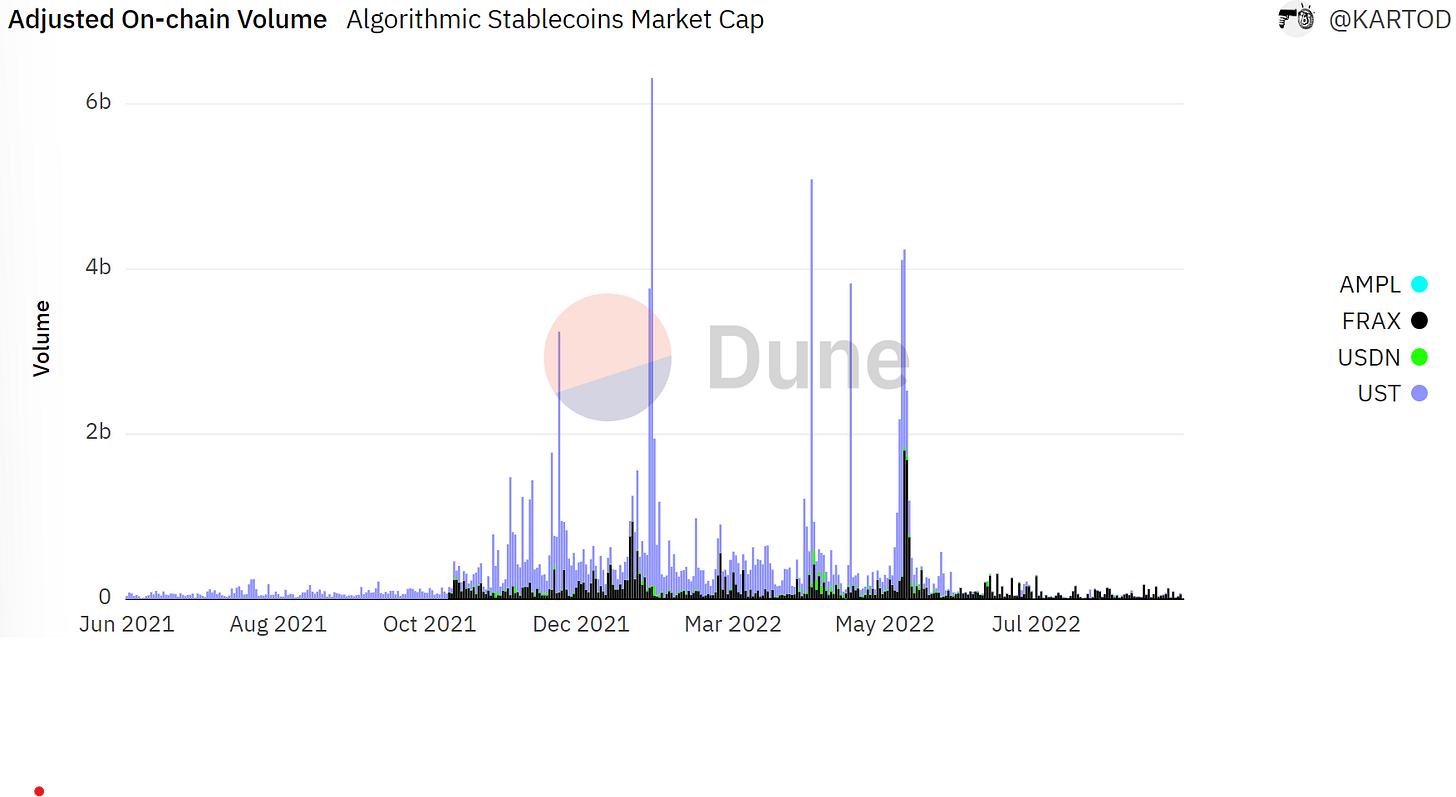
UST fell off a cliff in terms of volume a few months back for obvious reasons, leaving $FRAX as the clear market leader. Overall volume is way down over the past few months:
$FRAX certainly seems the best performer so far. It has maintained its peg admirably for the past year (along with $USDN). As for the others, AMPL seems to fluctuate regularly, and of course UST went to zero in mid-June.
So, what are the takeaways?
For better or worse, the market is dominated by centralized, fiat-backed stables controlled by bank-like entities like Tether & Circle. While $USDT is still (just about) the King, $USDC has carved out a large slice of the market for itself and leads in volume…..
Decentralized, overcollateralized stables like $DAI have successfully carved out a niche in the ecosystem, have mostly maintained their pegs well, and see heavy usage relative to their size. This category has seen little recent supply growth, but has seen decent volume growth over the past few months.
Algorithmic stablecoins are an innovative and interesting emerging paradigm. They still have a very small relative market cap, and are perceived as more risky and experimental - understandable considering the history. Over the past year the category saw strong growth, and $FRAX is emerging as market leader.
For more, check out the full dashboard.
Proof of Stake
Vitalik Buterin has been working on a long-awaited book, Proof of Stake, which will be released in late September in both digital and physical copies.
While digital and print copies won’t be available for several more weeks, you can order a digitally signed copy along with a non-transferable NFT by donating $ETH on Gitcoin. The proceeds will all be donated to Gitcoin grants.
Dune Wizards were quick to start tracking donations. Let’s look at a dashboard by @ivanmolto.
Already, over 155 $ETH has been donated:
That’s over $240k! Not bad at all for a book pre-launch, and all going to good causes.
There have been 25k donations so far from 23.5k unique donors.
This morning we can see hundreds of donations every hour:
With hourly donations averaging 1 - 1.5 $ETH, the average amount donated is rather low, which is to be expected because “any amount” will get you the signed copy & NFT.
Another dashboard by @wuligy tracks the donations themselves. The most common donation amount was 0.001 $ETH, around $1.50 - these people are getting value for money!
This is an interesting experiment that seems to be proving scalable, which could serve as a model for book launches in the future.
Check out the full dashboard for more, and this other one by @gm365 for extra insights.
Mirror on Optimism
A few months back Mirror, Web3’s answer to Medium, tapped Optimism for the launch of their writing NFTs.
The platform allows writers to create NFTs of their pieces - which others can then “collect” to support their work and own a piece of history.
@gm365 released a dashboard this week covering things, let’s take a look.
Mirror allows writers to mint “editions” - a limited supply of identical NFTs at a fixed price. So far 5087 editions have been created.
These have been collected almost 40 thousand times:
By 17.7k collectors!
The concept of writing NFTs seems to really be gaining some traction. the number of collectors and collected editions has risen nicely through August:
For a deep dive on writing NFTs, take a look at some of Team Mirror’s official dashboards.
And of course, check out the full dashboard by @gm365.
Contract Interactions
This week Team @sixdegree made a dashboard examining contracts on different chains. They came to some interesting conclusions.
On Ethereum, there are 50.85 Million contracts.
Of those, 95% have been interacted with 10 or fewer times, and only 132.4k have been interacted with 1000+ times:
On BNB, things are even more stark. Of the 138.1 Million contracts, only 2.3% have been interacted with more than 10 times - with 265.8k breaking the 1k interaction milestone.
Arbitrum has the most balanced distribution in this regard. Of the 96.2k contracts, 12% have crossed 100 and 6% have crossed 1000 interactions.
What’s the conclusion? The creators of the dashboard put it in rather blunt terms:
This means most contracts are shit, especially the BNB and Ethereum, the BNB is 97.7% and Ethereum is 95.1%.
Is this true? Somewhat of course, but that’s the nature of a permissionless platform where countless people tinker and build!
The rewards and traction always flow to a small % of players in any industry, and the nature of crypto makes that even more pronounced. Check out the full dashboard for more.
Nike/RTFKT SZN 1
@kingjames23 released a dashboard a few weeks back that really blew up.
It covered famous brands and their experiments in NFT land, and stunned people with the revelation that Nike had pocketed over $90 Million in total royalties!
This week he released another dashboard tracking the Nike/RTFKT SZN 1 Pre-Forging Mint.
This is an interesting project featuring apparel designed for CloneX holders, and NFTs that can be redeemed for specific physical items at no extra cost!
Mint revenue is already at $4.19 Million - bringing in royalties of $86.7k……
Almost 20k items have been minted:
By over 2.3k minters! Some items were free to mint, some were paid with an average spend of $2.6k.
Various editions of Air Force 1s seem to have been the most popular items so far, with the top one - “Murakami Drip” - bringing in over $1m in revenue:
Nike really seem to have found a successful model for integrating themselves into the world of NFTs, so this will be an interesting project to follow.
Chek out the full dashboard for much more data.
More Dashboards
GN
Thanks for reading everyone.
As always a special thanks to all the Wizards featured, you are all awesome! We’ll see you again next week for more data, dashboards and Wizardry.


op have token