


GM
Welcome to Issue #45 of Dune Digest!
We’ve got an action packed issue for you today. First though, some news to keep you in the loop.
News
The First Dune Arcana session went great last week. We’ve got another one next Thursday at 14:00 UTC, covering BendDAO’s liquidity crisis - come join us…..
Top Wizard @ilemi aka Andrew Hong released an insane Dune tutorial covering Sudoswap, Spellbook abstractions, liquidity simulations, and much more. Read it, and watch the video too!
We reworked our content site, you can now see all our written and audio content in one place. And we’re going to be doing much, much more on there soon…..
Hundreds of Wizards have confirmed their place at DuneCon, which is less than 3 weeks away! There’s still space though - come join us…..
Dune Teams….. so Far!
Teams is less than two months old, we officially announced it in mid-July…..
Since then, more than 170 teams of all shapes and sizes have sprung up and shipped some amazing dashboards.
Last week Dune’s Growth Manager Alex Letsas wrote a great piece on Dune Teams.
It covers:
Why we built Teams, and who we built it for
Top teams created so far
The Future of Teams
A detailed FAQ
We’ve had everyone from major media brands, researchers and protocols, to Wizard collectives and DAOs setting up teams so far. And this is just the beginning.
So we thought that in this week’s Dune Digest we’d highlight some of the top Teams so far and their great work!
Let’s get into the data……
Blockworks Research on Curve
Blockworks is one of the top media brands in crypto, bringing well-researched and authoritative coverage to current events in the industry.
Their research arm created a Dune Team - Blockworks Research - consisting of well-known Wizards like @sashimiboi, @smyyguy, and several others.
This is a famous brand that needs its research to be top-notch, and that’s certainly been the case with the first two dashboards they created:
We covered Convex in a previous issue, so today let’s take a look at Curve……
Curve is a leading DEX, known originally for its highly efficient and low friction stablecoin swaps.
Firstly let’s look at the volume. Daily average volume for stablecoin-to-stablecoin swaps over the past 6 months is around $230m.
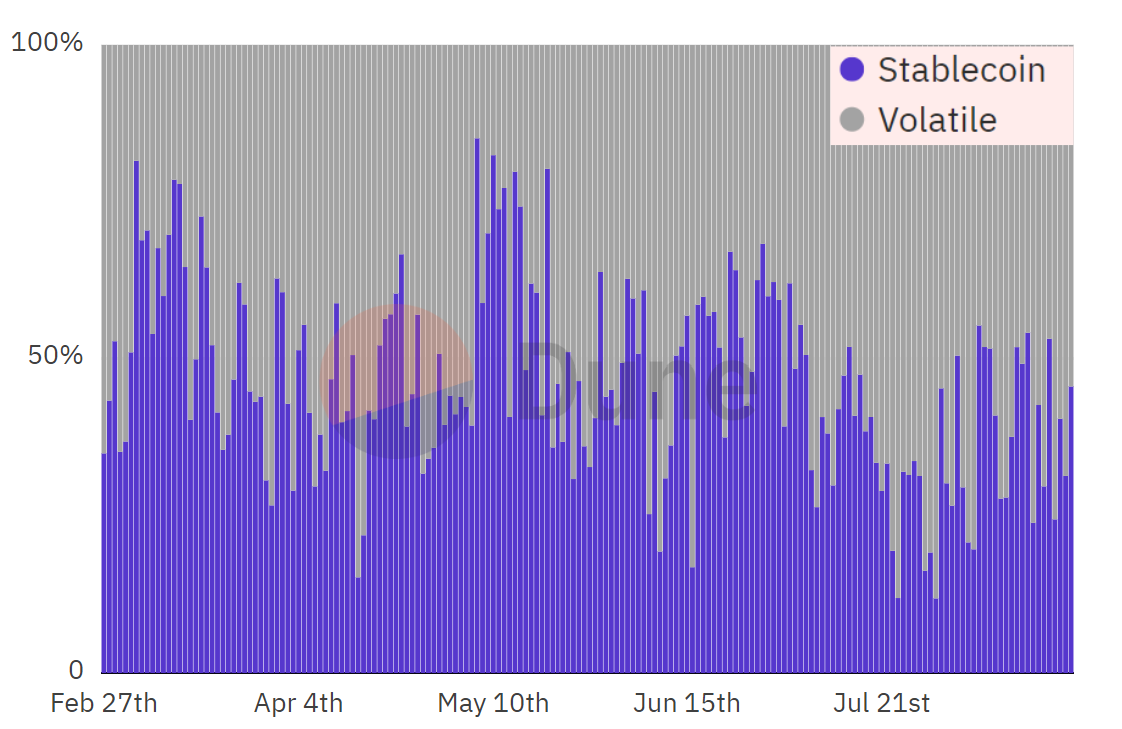
Though Curve is known for stablecoins, V2 supports various “volatile” assets like $LINK, $ETH, wrapped/liquid tokens like $wBTC & $stETH, & more.
Indeed, over the past six months stablecoins have represented 46.4% of total volume. Volatile tokens have also gained volume share over the past few months:
This is in the context of overall volume sliding considerably since highs earlier in the year:

How big is Curve as a share of the overall DEX market? Pretty significant, as you can imagine.
Though still eclipsed by Uniswap, Curve has averaged 15.7% of total DEX volume over the past 180 days:

All this activity is split across different pools, many being permissionless “factory” pools that anybody can create.
There are a few particularly important pools though which account for the majority of volume:
3Pool - holds a massive amount of Curve’s liquidity for the top three stablecoins: $USDT, $USDC & $DAI
Tricrypto2 - for $wBTC, $ETH & $USDT swaps
The other important one was the Wormhole v2 USD-3Pool, which was the most liquid DEX pool for $UST before it imploded.
Over the past 180 days, 3pool has averaged 20.2% of volume while tricrypto 2 has accounted for 35%.
Wormhole v2 was a substantial slice, representing 20-50% through February, March & April - before it drained overnight:

Though it only accounts for 20% of volume, currently 3pool is the #2 pool by TVL.
TVL has dropped significantly over the past few months though, from $4b in late February to “just” $927m today.
Another new pool, on the other hand, has been doing the opposite. The new Frax base pool has shot up from nothing to $766m over the past 2 months:

How about users?
For the past 2 years, weekly active users have been reasonably stable - with a slight drop over the past couple of months. Recently, Curve has had around 1500 active users per week, the majority of whom (2/3 roughly) have previously interacted with the platform:

Curve’s user retention rate seems to be solid, but not outstanding…..
Overall, Curve is an important part of the DeFi ecosystem that has found product market fit with its excellent stablecoin UX before expanding to other popular assets.
Check out the full dashboard for more, and keep an eye on @blockworks_research’s profile for future dashboards from this top team…..
Sixdegree Lab on Opensea
Although Teams is perfect for DAOs, companies and protocols - there’s another kind of Team emerging too.
Sixdegree Lab is the most prolific of a new breed of Wizard gang who are pooling their collective brain power and analysis skill to do incredible work.
We’ve covered several of their dashboards before. Today we’re going to share one of their recent creations - Opensea Overview with Seaport.
We’ve all heard recently complaints about Opensea volume reaching severe lows recently, and it’s true - especially in $ terms. Look at the huge drop from June:
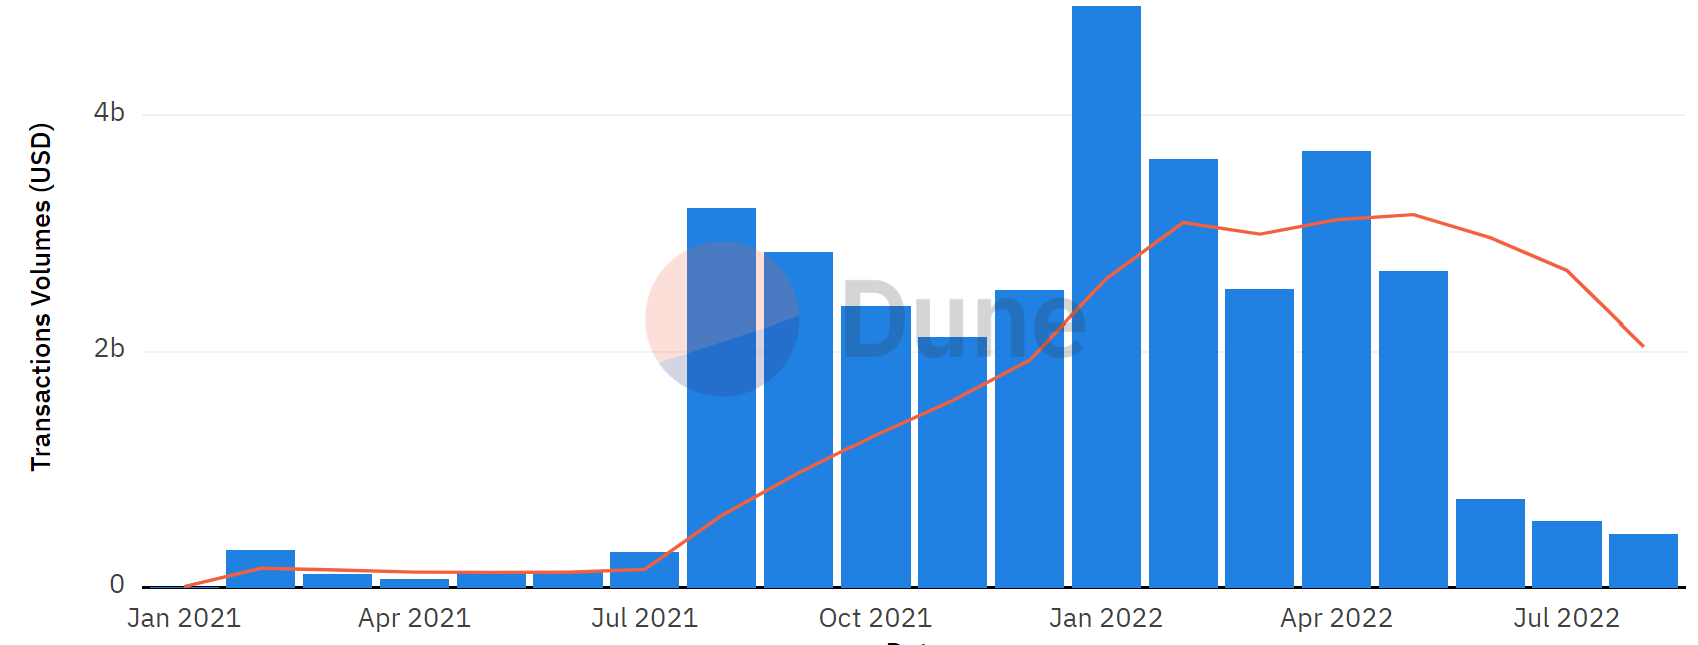
July saw $566m in volume, which sounds OK until you compare it to the multiple Billions it was earlier in the year.
That said, some other core metrics don’t look so bad. Daily transactions didn’t dip nearly so noticeably:
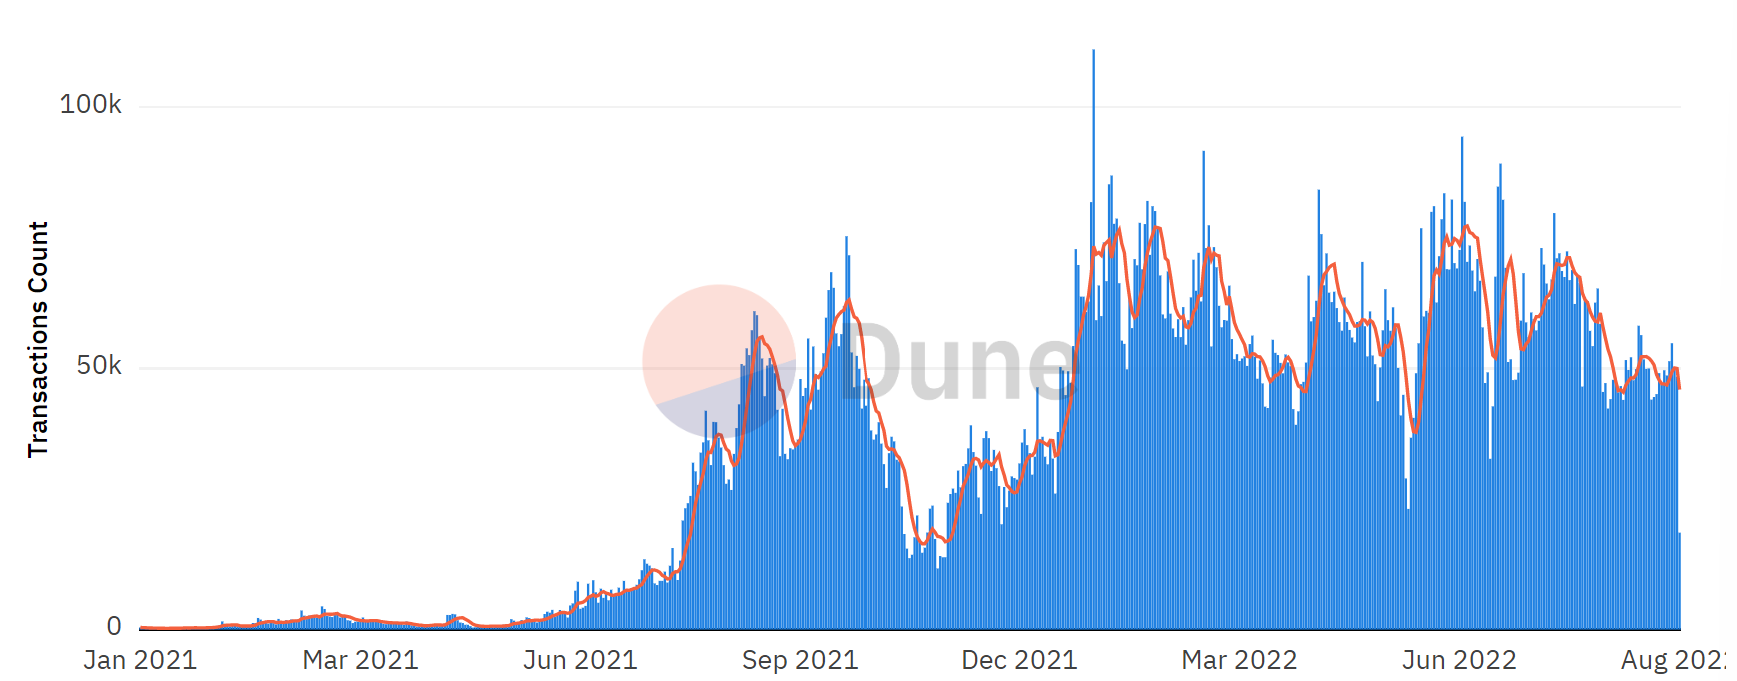
We can also see a weak growth trend in monthly transactions over the past few months.
Opensea is also acquiring new users (or new wallets, at least) at a healthy rate - with over 264k new active users over the past 2 months alone.
Overall, Opensea metrics aren’t looking as bleak as some may think, and beyond broader market factors things appear reasonably healthy. Check out the full dashboard for more.
We also recommend taking a browse over Team Sixdegree Lab’s other dashboards. The Blockchain Overview Series is particularly awesome.
Stratfi on $MKR Distribution
The Strategic Finance Core Unit is the analysis and reporting arm of the venerable MakerDAO.
They were one of the first protocol Teams to form, and they kicked things off with an interesting dashboard analyzing the decentralization and distribution of the $MKR token…..
Firstly, let’s look at the distribution. Currently, over 43% of $MKR is held in wallets with 10k-100k tokens. Given that the current price is $854.115, we can safely call them Whales.
A further 40% belongs to those holding 1k-10k. So over 80% of the total supply is held by those with over $850k in $MKR….

That’s only about 120 wallets.
12.5k wallets hold .1-1 $MKR, by far the largest cohort, yet they only hold 0.5% of tokens.
The number of holders with at least 1 $MKR steadily increased through to early 2021 before declining slightly and plateauing over the past year to the current count of 6442…..

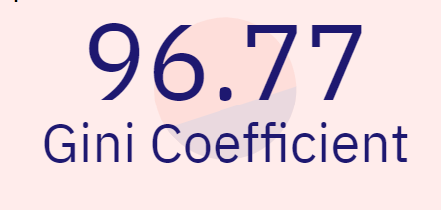
The Gini Coefficient is a formula that measures inequality among values in a frequency distribution.
0% is perfect equality with everyone having an equal share, and 100% is perfect inequality.
When we look at the measure applied to $MKR holders it confirms that the distribution is very unequal:
There are now over 90 delegators, a number that has risen sharply over the past 6 months. Still, only 15% of tokens are delegated!
It’s interesting to dig into the distribution of governance tokens like this. It seems that a lot of it hasn’t played out exactly how it was originally envisaged.
Check out the full dashboard for more and keep an eye on Team @stratfi.
MetricsDAO on….. itself
MetricsDAO is an interesting project with a mission to:
“Empower analytical minds and enable blockchains and protocols to succeed. It's critical for blockchains and all ecosystem participants to have the data, insights, visualizations and metrics that enable an active, educated and informed community”
We couldn’t agree more!
The DAO achieves this through sourcing analytical questions that need answers, prioritizing them through an upvoting system, peer reviewing solutions, and rewarding participants in partner tokens.
All in all it is an interesting DAO. Participants can use various platforms to answer questions, and many use Dune. MetricsDAO also formed a team recently, and shipped a dashboard covering their key stats.
So far they’ve distributed over quarter of a million dollars on Ethereum to 386 wallets:

The treasury is a hefty $314.8k, funded by grants from partners like Uniswap and other protocols and companies. Looking at the grants coming in to the DAO’s Gnosis Safe, we can see some pretty hefty ones:

MetricsDAO often pay out their analysts in batch transactions. The dashboard notes that they use parcel.money, a treasury management tool, that they estimate has saved them 112.477Ξ in gas costs.
Overall, we’re impressed with what MetricsDAO have built. We’re glad to have them as a Team and look forward to seeing what their analysts build on Dune in the future.
Check out the Team - which includes well known Wizards like @danner_eth & @rplust - and check out the full dashboard for more!
21Shares on NFTs across Chains
Based in Switzerland, 21Shares is the world’s largest Crypto ETP provider, servicing clients with a wide range of crypto-based financial products and services.
They have been making waves on Dune for some months, producing some excellent dashboards on unusual topics with the help of their in-house Dune Wizard Tom Wan!
Check out their work on the Team Profile…..
Whenever Team 21Shares releases a dashboard, you know it’s going to be good, and the latest this week covers the NFT market on 4 different chains. Let’s take a look……
Firstly, the 24 hour volume on each:
Ethereum $37.3m
Solana $2.72m
BNB $155.3k
Avalanche $78.8k
Ethereum is obviously still the king, but Solana has definitely carved out its own niche.
The number of trades is almost exactly the same:
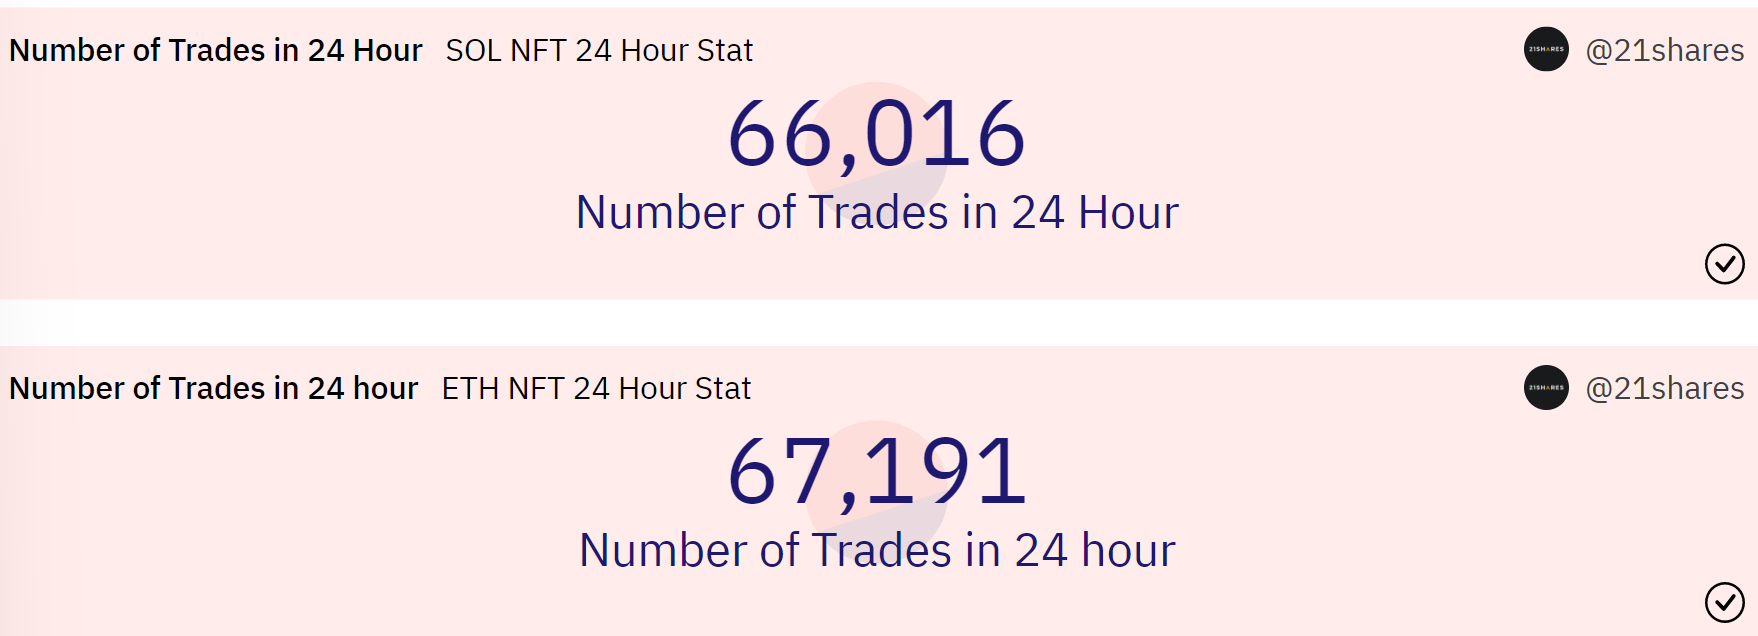
But the number of traders is much higher on Ethereum along with the average trade size. Based on this data it seems like Solana is more popular for smaller, more frequent trades.
Both have seen a similar dip in volume and usage.
The marketplace split is interesting. By volume, Opensea dominance has been sliding a little over the past few months as X2Y2 slowly grows its market share. We can also see newcomer Sudoswap rising over the past couple of weeks:

On Solana though, MagicEden dominates volume more than ever with 97%+ of the market. We see similar Opensea dominance on Ethereum when we look at users with 85%+ using the platform.
On BNB and Avalanche, average trade size is more than double that of Solana at $97 and $99 respectively.
The BNB market held relatively strong over the past quarter, hitting $18.7m volume in June with 18k buyers and $22.3m with 22k buyers in July…..
Avalanche on the other hand has seen a significant drop in both volume and buyers since earlier in the year:

Since March, BNB sees 5x-10x the monthly volume and buyers of Avalanche…..
NFTs are more of an “emerging” market on BNB and Avalanche, and there aren’t yet clear leaders in terms of marketplaces.
Bitkeep NFT Market has been fairly dominant on BNB - but Tofu, Pancakeswap and Element are all competitive:

When we look at the number of buyers, Element and Tofu lead the market in recent weeks.
On Avalanche by volume, Joepegs has really grown over the past 2 months. Joepegs is also snapping up an increasingly dominant share of buyers:
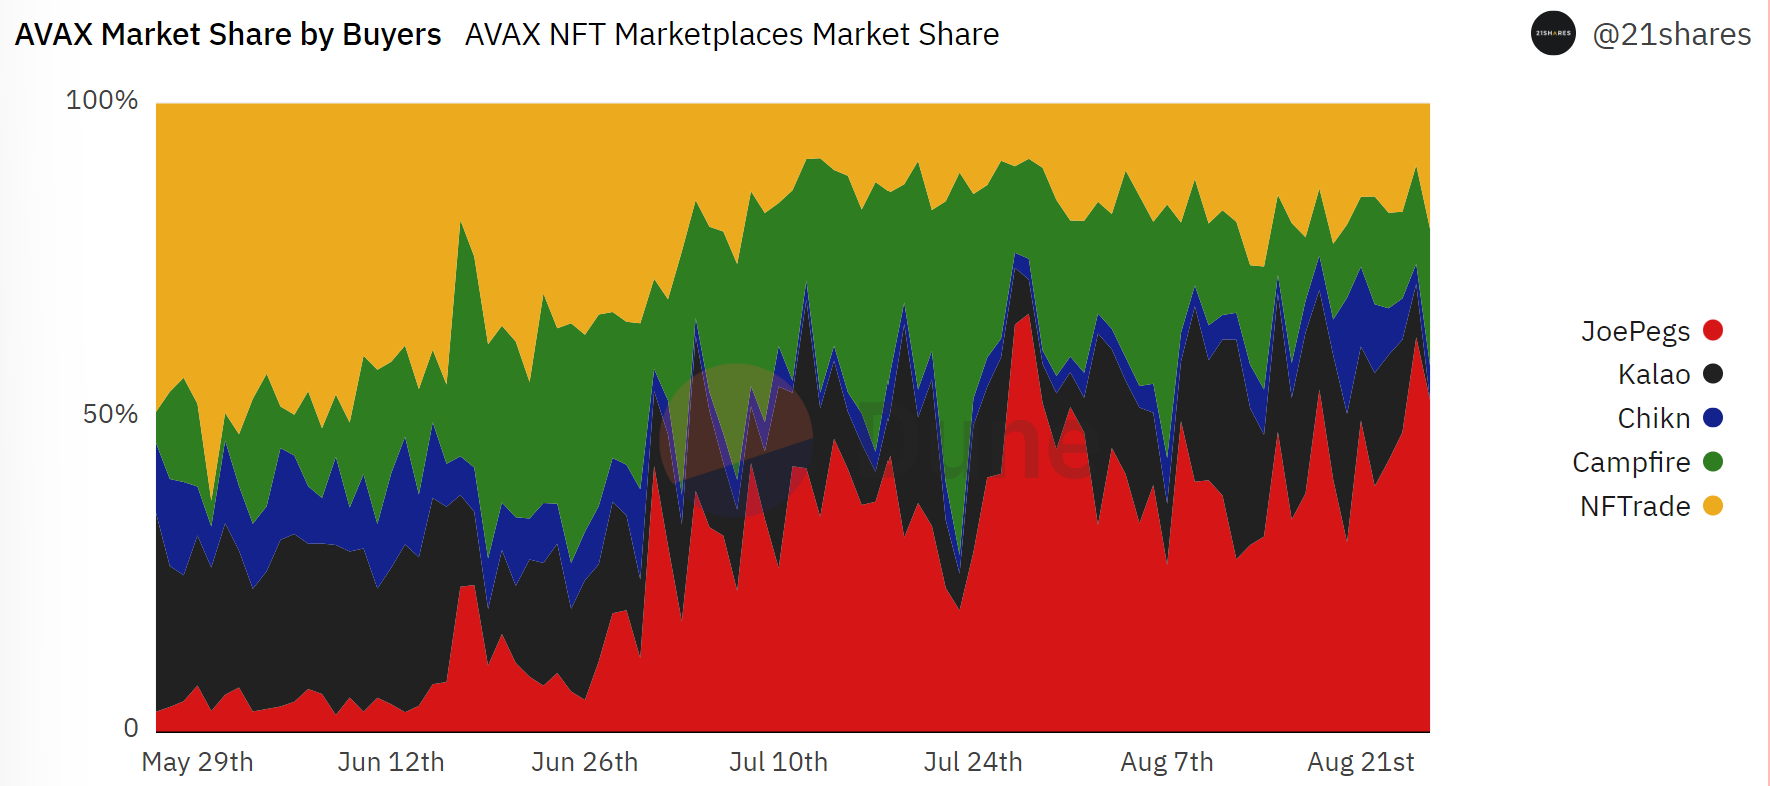
Overall, Element looks very well positioned on BNB as does Joepegs on Avalanche.
NFT activity on both chains is small compared to Solana and Ethereum. That said, in July BNB volume was almost one third of Solana’s…..
Ethereum is still in a league of its own when it comes to the high-end, high-value NFT market. But it’s no longer the only game in town!
Check out the full dashboard for more. Also, take a look at some of Team 21Shares’ other great creations:
Optimism on Core Platform Metrics
The members of Optimism’s Team have been Dune veterans for a long while.
So it was no surprise that they were one of the first big names to form a Team with top Wizards like @mslib7, @chuxin, and others!
One of their neatest dashboards is this one covering detailed protocol metrics. This dashboard is a wealth of data, let’s look at some of the key metrics……
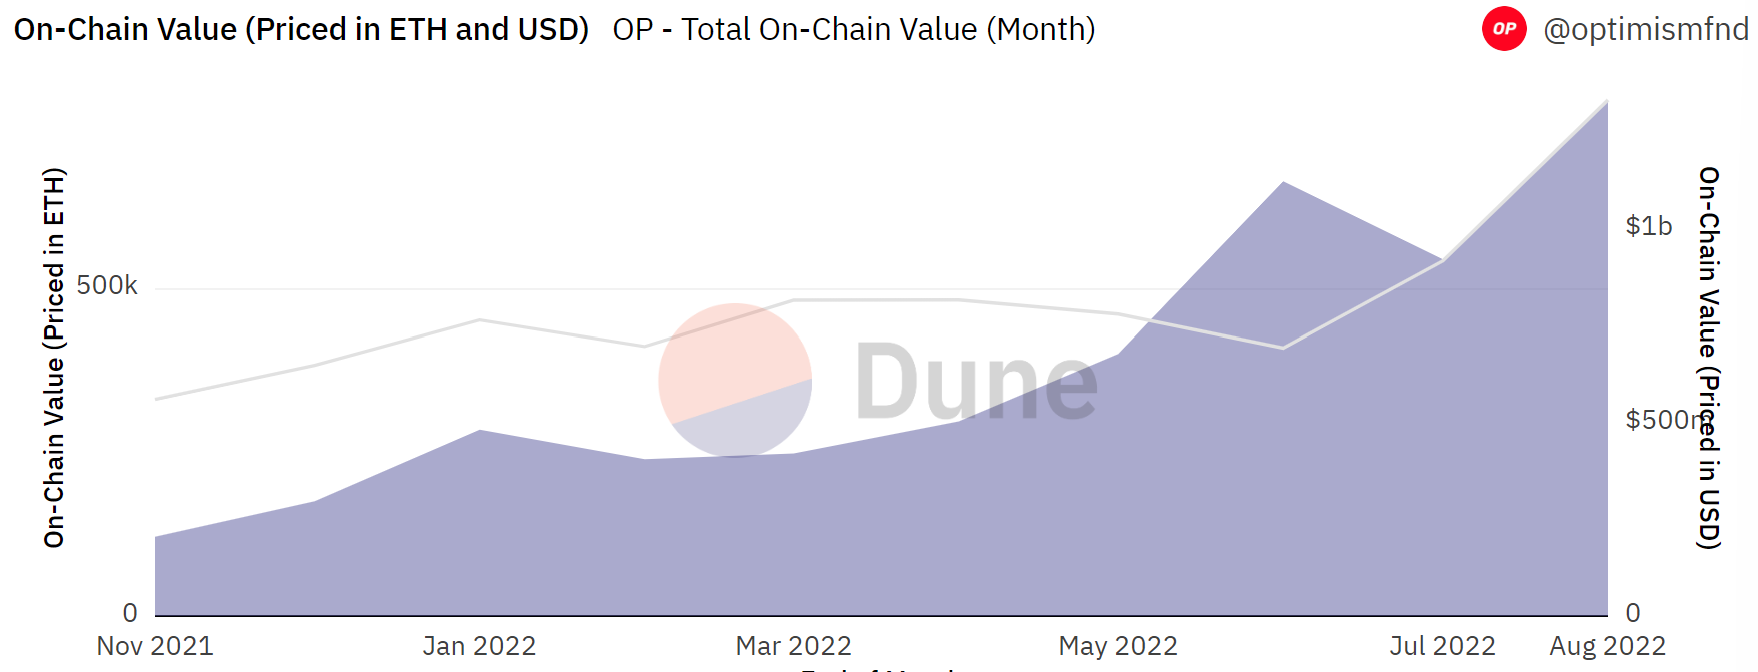
Earlier this month, Optimism crossed $1 Billion in on-chain value:

On-chain value - the total value held in wallets and locked in contracts on the network - has been really growing in recent months:
Optimism processes a whopping 152.5k transactions per day on average for more than a quarter of a million addresses (30 days).
Optimism, along with other L2 scaling solutions, is so popular because of the better UX and lower fees compared to L1 Ethereum. The average gas savings compared to L1 are 150x, saving more than 50k $ETH over the past 30 days:

Transactions cost from $0.06 to $0.12 for anything from transfers and swaps to DEX trades and NFT mints.
Transactions per month rose steadily since early 2022. Although they peaked in June at 3.9m, July and August have both been strong months with 3.4 and 3.5m respectively:

Overall, there seems to be a lot of good reasons to be optimistic about the platform’s future (couldn’t resist), check out the full dashboard for much more data.
We’re very happy to have Team Optimism on Dune, and they have many more dashboards that are perfect for a deep dive into the ecosystem - check them out!
More Dashboards
NFT Brand Case Study by @kingjames23 (this dashboard went viral this week!)
GN
Whew, that’s it for our special Teams edition.
From next week on we’ll be back to our normal format. Thanks for reading, and thanks to all the amazing Teams on Dune for their creations.
As we’ve seen, all manner of groups are setting up Teams. From research firms, media outlets & institutions to protocols, DAOs and talented groups of Wizards - Teams is for everyone.
Want to set up a team for your own company, or with your colleagues or fellow Wizards?
It’s super simple and takes less than one minute. Check out this article, which explains the exact steps in setting up a Team and also lists all the top teams so far. Also, take a look at the explainer in our docs.
See you next time and enjoy your weekend.