


GM
Welcome to Issue #39 of Dune Digest!
To kick things off, we have two pieces of exciting news…….
Avalanche data is now live on Dune!
Wizards and Avalanche fans alike have been looking forward to this one, now the day has come.
There are 4 tables live and ripe for querying:

There’s a lot to learn and a lot to explore on this interesting and unique L1 - we’re excited to see what Wizards build!
Shortly, we’re going to break down some of the best Avalanche dashboards so far.
Firstly though - more news……
Spellbook
Spellbook is an overhaul and retooling of our abstractions repo - leveraging OS analytics engineering tool dbt.
Spellbook is a leap forward in open source analytics.
It’s going to make Wizards a lot more powerful and efficient, and open up a world of new possibilities.
Community Takes
@Marcov breaks down some of his best dashboards - looking at Opensea, Velodrome, Convex & more [link]
@hildobby explains what happened to vested $LOOKS tokens from the private sale after they unlocked [link]
@21shares explores the potential contagion from 3AC & Celsius [link]
@frank_maseo explains Sturdy Finance through his winning dashboard [link]
Pyth Network break down their performance via a great dashboard by @cctdanie [link]
@otec_soram looks at Solana DEXes through Dune dashboards [link]
Avalanche Overview
Launched in 2020 with a mission to solve the problems of existing smart contract blockchains with an innovative design - Avalanche is an interesting beast.
In their own words:
Avalanche is the fastest smart contracts platform in the blockchain industry, as measured by time-to-finality, and has the most validators securing its activity of any proof-of-stake protocol. Avalanche is blazingly fast, low cost, and green. Any smart contract-enabled application can outperform its competition by deploying on Avalanche.
So let’s start with some high level Avalanche metrics through an awesome new dashboard by team @sixdegree.
Total transactions are at 185 Million.
Transactions peaked from January to March - falling by 34% in May and a further 54% in June:

Total accounts are at 2.94 Million!
Though active users have also dropped off in recent months (along with most other L1s) it isn’t as stark.
In June, Avalanche had 338.5k active users in total - down from highs of 700k+ in December and January:

When it comes to acquiring new users, Avalanche had amazing growth in November and December 2021 - adding 462k in each.
This declined in 2022, but was still at 200k+ monthly until June when it dropped to just over 100k.
While other metrics were cooling off - new contracts were booming with 5.3k added in May and 11.3k in June.
There are 120,315 in total. The top contracts by activity are:
Wrapped Avax
$TUS (an in-game token)
Game / Crabada
After that there’s a long tail:

In the dashboard, you can explore the contracts in detail through avascan links. There’s also a ton more data on deposits, token supply, gas and much more.
The most comprehensive Avalanche dashboard so far - check it out!
Avalanche Token Supply
So how much value has bridged to Avalanche? @avalabs, another new team, put out a great dashboard explaining things.
The first visualization shows the supply of bridged tokens over time.
Things peaked in around the first few months of this year, before dropping off around March.

$USDC was the most popular with bridgooors, with a supply of almost $2 Billion on Avalanche in late February.
Right now $USDC still dominates at $409m, but $DAI isn’t far behind at $254m.
After stables - which account for almost half of total bridged supply, we get to wrapped assets.
There’s over $284 Million worth of Bitcoin on the platform - the majority in the form of $wBTC with $41m in $BTCb.
There’s also $236.4 Million of $wETH and relatively small amounts of other assets like LINK & $AAVE.
DeFi users are clearly keen on putting their assets to work on Avalanche!
Interesting stuff - check out the full dashboard for more!
Avalanche NFTs
How about NFTs on Avalanche? The team at @avalabs gave us a cool dashboard covering that too!
There are 5 main NFT marketplaces on Avalanche:
NFTrade: a cross-chain marketplace supporting Avalanche native NFTs
Chikn: a marketplace specifically for the 10k Chikn collection and the ecosystem around it
Kalao: an Avalanche only marketplace which seems to have a focus on premium and metaverse collections
Campfire: A social-focused marketplace known for its .fire name service
JoePegs: NFT branch of Trader Joe, the largest AMM on Avalanche
Of these, NFTrade was the first to launch. Through most of 2021 and 2022, it had by far the most unique buyers - peaking at over 4.5k for several weeks in January and February.
NFTrade enjoyed a few months competition free, before other platforms launched and started to catch up. Over the past month both Campfire & JoePegs have flipped them in terms of unique buyers:

Moving on to volume - again we can see the evolution of the market since late 2021.
Though NFTrade was the leader through much of Q1, Chikn and Kalao made strong gains.
For most of the past month though, JoePegs has been #1 by volume as well as unique buyers:

Another interesting visualization is the average trade size. In this metric, Chikn dwarfs the rest:

Overall, the NFT market on Avalanche seems like it is still emerging and developing. There’s no clear dominant market leader like Opensea, and newly launched platforms are still experimenting and finding their feet.
An interesting space to watch - check out the full dashboard for more!
Joepegs
Speaking of Avalanche NFTs, JoePegs is clearly already becoming a key player. @0xManny made an interesting dashboard examining the platform…..
Since launching in early May, the platform has had:
4,203 total users
10,594 total sales
46,695 $AVAX total volume
Sales really started to pick up this month.
Throughout July projects like Chad Doge, Degen Frogs, and Scourge Apes were frequently racking up hundreds of daily sales:

The two most successful projects by volume are Smol Joes and Smol Lands - doing 8.4k and 7.8k $AVAX in volume respectively.
With total users having grown more than 4x in July - JoePegs seems to be gaining traction. Check out the full dashboard for more.
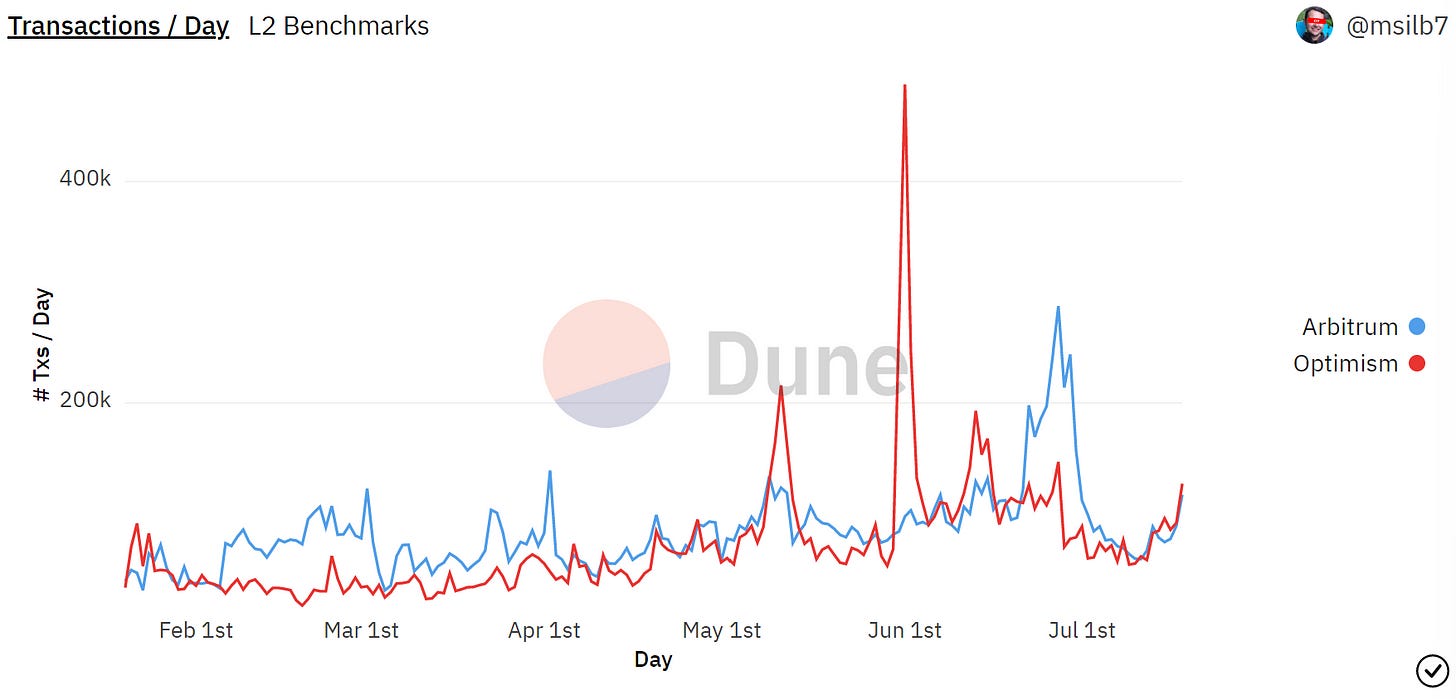
Arbitrum vs Optimism
Optimism and Arbitrum are two impressive and fast-growing L2s on Ethereum.
Now that we have Arbitrum data in Dune, we can compare the two - through a new dashboard by @mslib7.
Firstly, which gets the most usage?
From early February to early April Arbitrum was regularly doing double the daily transactions of Optimism - but from April onwards things evened out with Optimism taking the lead several times.
Apart from the large spike around Odyssey, they seem reasonably level:
When we look at addresses though, we see a different picture. Arbitrum seems to have significantly more daily active users:

How much gas do they use on L1 per transaction? Through March, Optimism was more gas hungry, but roles reversed since with Optimism looking significantly more efficient for the past several months:

Both have seen a drop in gas fees since late January, with <$.30 average fees for both over the past couple of months.
Arbitrum tends to be slightly higher, but the difference is negligible and both provide vast savings to users.
An interesting dashboard covering two very important platforms - check it out for more.
More Dashboards 🔥
Before you go, check out @hildobby’s new CV:

GN
Phew - thanks for reading.
As always, a special thanks to all the Wizards of the week for their excellent work.
We’re so excited about Spellbook and Avalanche, watch this space and see you again next week.
The data must flow…….