

Dune Digest #34
Crypto VCs, NFT Floors, Seaport & More!

GM
Welcome to Issue #34 of Dune Digest!
Some quick news….
This week, we were very excited to announce that we have now completed the view creation of *all Ethereum projects* on Dune Engine v2. Now v2 is on par with v1 for Ethereum mainnet - with all the benefits that brings!
An exciting time to be a data scientist in crypto…….
Now, let’s get into the data.
Crypto VC Allocations
Large trading and investment institutions got into crypto in a big way over the past few years, changing the space forever. They are the topic of frequent discussion, rumor and interest - especially over the past few weeks……
One of the great things about the open nature of crypto data though, is that it’s possible to take a peek “under the hood” of these firms in a way that would be more difficult in tradfi.
For example, this week @shogun put out a dashboard examining the allocations of some prominent crypto investment funds. Let’s take a look…….
Three are analyzed in the dashboard:
Three Arrow’s Capital
Wintermute
Jump
We’ll look at 3AC since they’re the hot topic of the week.
The total value of their portfolio allocation tracked in this dashboard is $196,142,213 - down from $400m+ just a few days ago.
Right now $CEL makes up the largest allocation at $42.29 Million, followed by $USDT at $32.3m, and some other significant stable holdings of $GUSD, $USDC & $FTT.
They also hold $8.3m worth of $PAXG, an ERC-20 token backed by physical gold, and several other assets like $LINK and $LIDO in smaller quantities.

The makeup has changed over the past day. Yesterday there was $183.5m in $USDC which is down to $16.5m today!
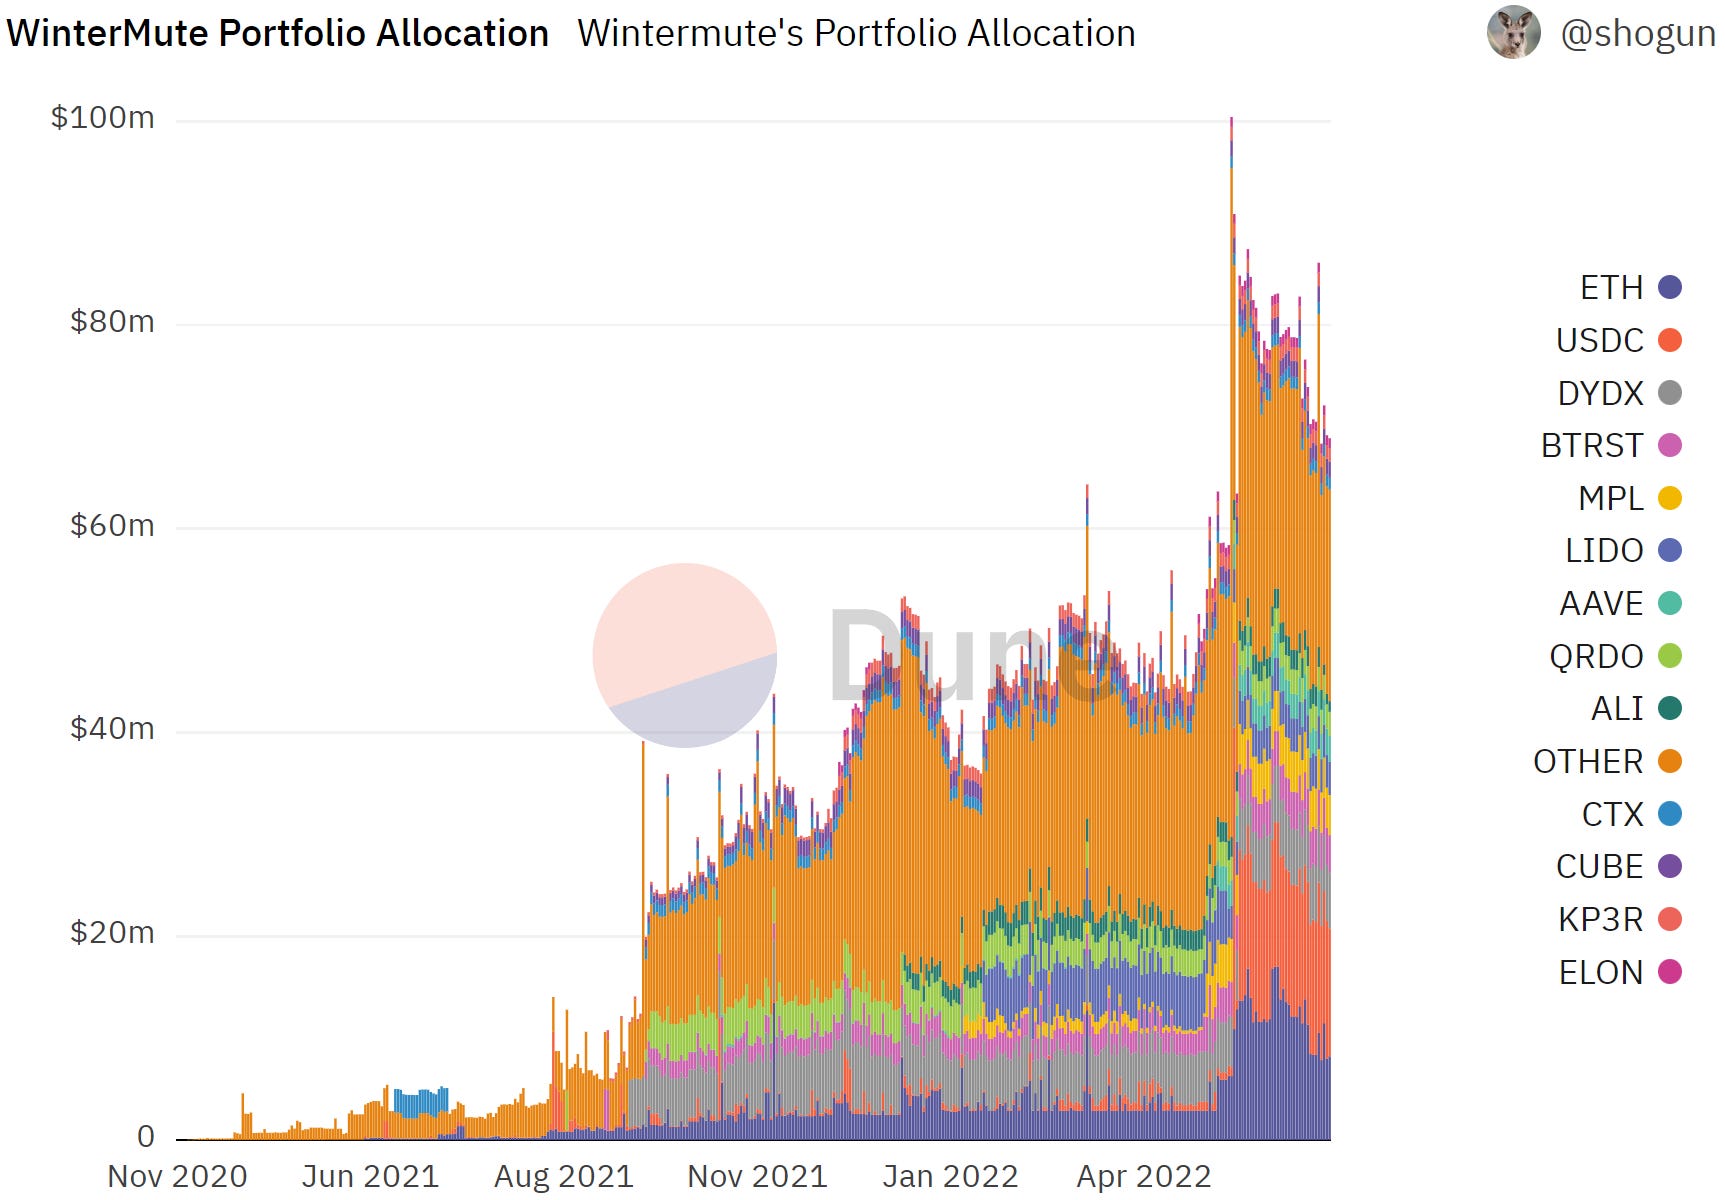
The other two outfits covered, Wintermute and Jump, have quite different allocations.
Wintermute’s portfolio value sits at $68,916,739 across a range of assets. Check out how their portfolio grew and diversified across late 2021 and early 2022:
Jump are the biggest Whales, with $1.787 Billion worth of crypto in their portfolio. They’re heavily weighted towards $ETH, with holdings worth $1.42 Billion!
Disclaimer: this is based on an analysis of several wallets identified, we cannot guarantee that this is a comprehensive view of their holdings
A very interesting dashboard, check it out for much more.
Are JPEGS Rekt?
On Wednesday, Twitter personality @krugermacro noted that out of 12,922 cryptocurrencies:
12,902 had fallen at least 70% from their ATH (99.8%)
12,763 had fallen at least 90% from their ATH (98.8%)
$BTC was down 69%
He suggested that somebody should do the same analysis for NFTs. @0xManny answered the challenge and put out an interesting dashboard tracking floor prices of prominent NFT projects relative to their ATHs.
Let’s take a quick look…..
In a nutshell, NFT floor prices have taken a battering, but seem to have fared relatively well compared to the average altcoin.
125+ tracked collections have fallen more than 90% from their ATHs in Dollar terms. Here are a few examples of the biggest droppers:

When we look for the bigger names, some are faring worse than others:
Art Blocks - 96.13%
Cool Pets - 95.36%
Cool Cats - 89.3%
Hashmasks - 89.25%
Azuki - 89.18%
Mutant Apes - 80.9%
Bored Apes - 77.8%
Blue chip projects seem to be much better at holding their value on average compared to more obscure ones - as you might expect……
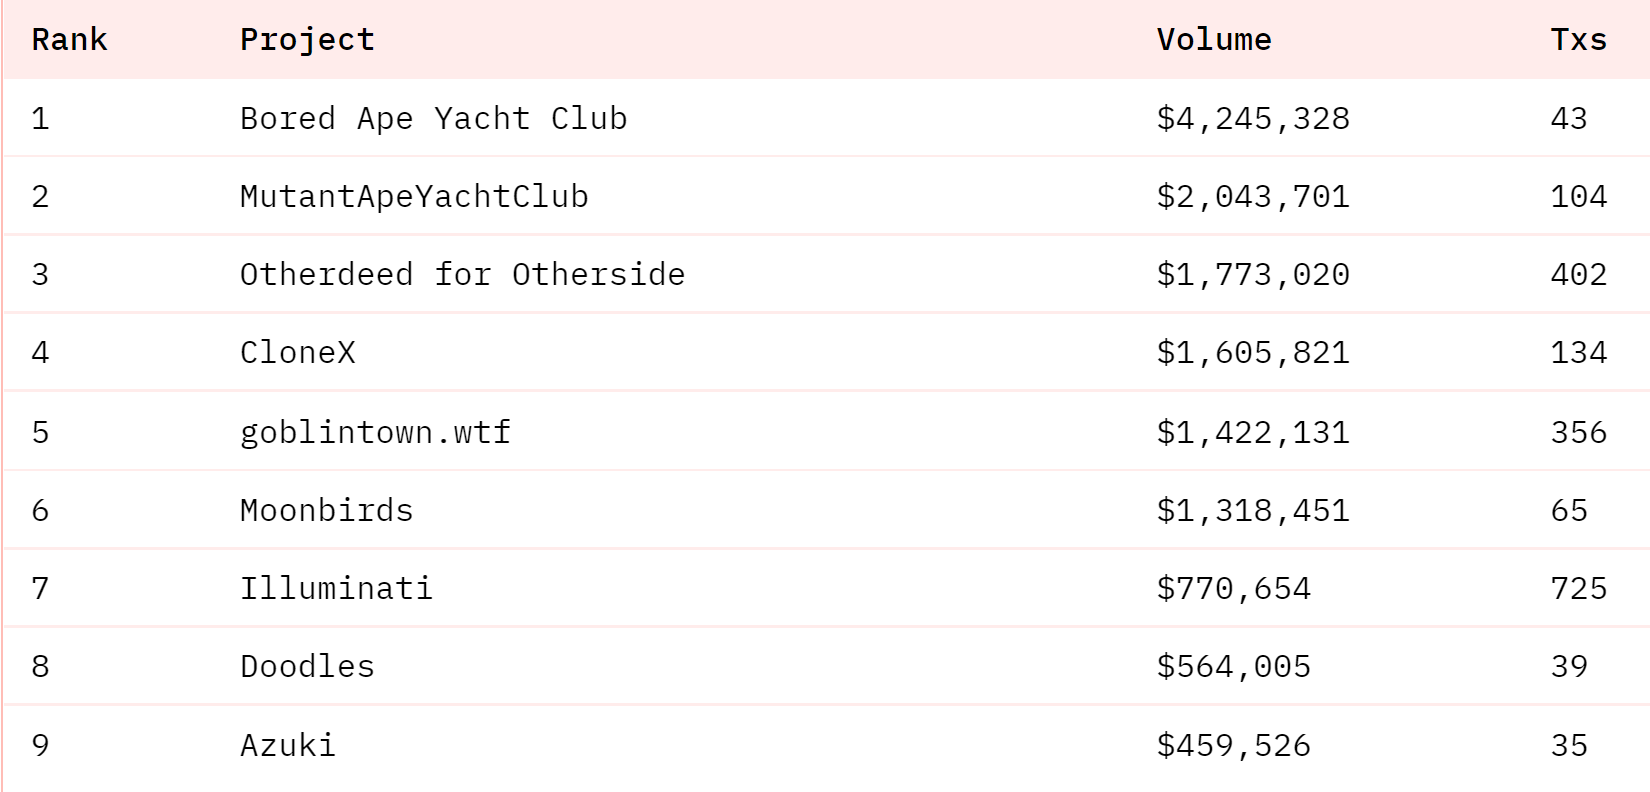
And these top collections are still doing a significant amount of volume:

Though volume overall on major platforms is way down over the past month, as we can see through @rchen8’s legendary Opensea dashboard:

It’ll be interesting to see how NFTs fare through their first major bear market. Check out the full dashboard and have a click around with the filters!
Mega Metaverse
We’ve covered JPEGs, now how about the Metaverse?
Wizard @KARTOD put out a Metaverse Mega Dashboard this week, let’s look at some of the highlights.
When we look at the past successes of the main Metaverse platforms, NFT Worlds reached the highest historical floor price at 12.16 $ETH:

Otherdeed also hit a 5.45 $ETH floor, and Decentraland hit 4.54……
This was all in the heady days of late 2021 and early 2022.
With the exception of Aether, all tracked Metaverse projects are now 80-95% off their ATH in $ terms:

Overall, the project that generated the most total volume has been Otherdeed for Otherside, accounting for 66.9% of the total - a whopping 283,734 $ETH:

Otherdeed has done 1,177 sales this week and over 4,278 $ETH in volume - but is itself 86.46% down from its ATH which occurred 49 days ago.
What’s next for the various Metaverses? Take a look at the dashboard and decide for yourself…….
Will Seaport Deliver?
OpenSea announced this week that they were moving onto a new, open-source protocol called Seaport.
They claim that the back-end revamp will reduce gas fees for users, & enable a suite of new features and UX improvements.
@Marcov was fast with a dashboard, so let’s see how Seaport is doing so far…….
Seaport has already seen 61,540 total unique users. They’ve done 75,292 transactions and generated $33.95 Million.
Impressive for just a few days!
One of the claims about Seaport is that it will lower fees for users - Opensea estimated a 35% gas saving on transactions. How’s that working out?
So far, well.
Check out this comparison between Seaport and Wyvern v2, the old contract:

Over the last 10k transactions on both contracts - Seaport gives significant gas savings.
The top sales so far are the usual group of hot and blue chip projects:
Another benefit of Seaport, according to Opensea, is the ability to “quickly build new features”.
One new feature is “collection offers” - where you make one offer on all items in a collection.
Users are already experimenting. Take Wednesday this week as an example.
$10.8 Million of the volume was “buy now” orders, but $1.3m was collection and trait offers!

Check out the breakdown of order types:

Interesting. We’ll watch for new features that Opensea put out, and expect them to keep building throughout dim market conditions!
Check out the full dashboard here.
Yearn, Baby, Yearn
One of the OG success stories of DeFi, Yearn is a popular topic of study for Dune Wizards.
This week @1chioku released an interesting dashboard examining Yearn Finance’s governance.
To begin - the token seems to be well dispersed with over 61,000 unique holders.
Many large holders are institutions like Coinbase, Binance, Curve, and FTX.
What are they using those tokens for?
Some of them are voting on Yearn Improvement Proposals - of which there have been 8 since April 2021:

All have passed with an overwhelming yes!
The bad news is that voter participation has been declining sharply. YIP-60 had 2,732 unique voters, but the most recent YIP-67 had only 134!
At the same time, $YFI voting power itself remained relatively constant:

What is the reason for this?
@1chioku writes in the dashboard that:
Taking a closer look at voting power distribution, the individual YIP votes, all hold horrible Gini coefficient of near 1 (near perfect inequality)……… This elevated Gini Coefficient seems to correspond with a certain pattern where the outcomes of the YIPs are determined by few key whales as shown in the "Voting Results $YFI - Voters" table.
This seems to be a common struggle for DAOs. The original goal is often to democratize governance among the masses, but you end up with something more like a powerful board of directors making decisions.
An interesting dashboard, check it out for more data.
If you want to dive more into Yearn Governance - check out this even more comprehensive dashboard by @mausefalle.
More Dashboards
GN
Thanks for reading another issue, we hope you enjoyed it. Dune Digest, and Dune in general, are going to be right here with the community no matter the market conditions - so let’s keep building and learning!
A special thanks as always to the backbone of on-chain data, the Dune Wizards.
See you next week for more.
The data must flow.