Dune Digest #20

GM
Welcome to Issue #20 of Dune Digest!
This week we had an awesome interview with Tom Schmidt on The Weekly Wizard. Tom is a general partner at crypto venture firm Dragonfly Capital, and previously worked at 0x Project and Facebook.
He was a great guest - and shared a ton of knowledge with us. Check out the interview:
Now, let’s get into the week’s data and dashboards……..
Solana User Base
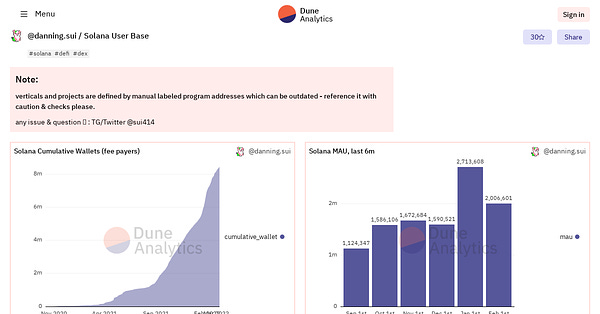
An excellent dashboard was released this week by @danning.sui that covers high level usage metrics for Solana.
So, how big is Solana and what is it really used for? Let’s find out.
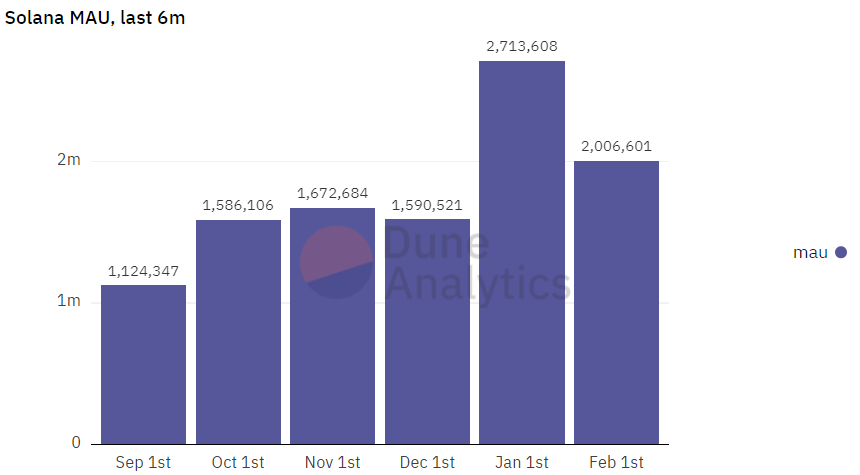
Monthly active users were steady through Q4 of 2021 - but really shot up in the new year, breaking 2.7 Million in January and 2+ Million in February:
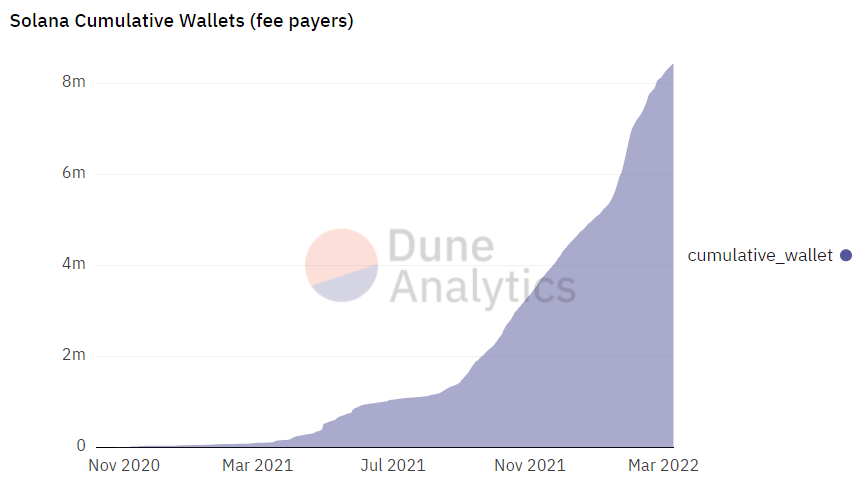
Another way to see this healthy trend is by looking at cumulative wallets. We can see them growing slowly through the beginning and middle of 2021, before surging in Q3.
In 2022, total wallets grew by more than 60% - from approximately 5 Million to 8.4 Million:
What are most of these users doing? Let’s investigate.
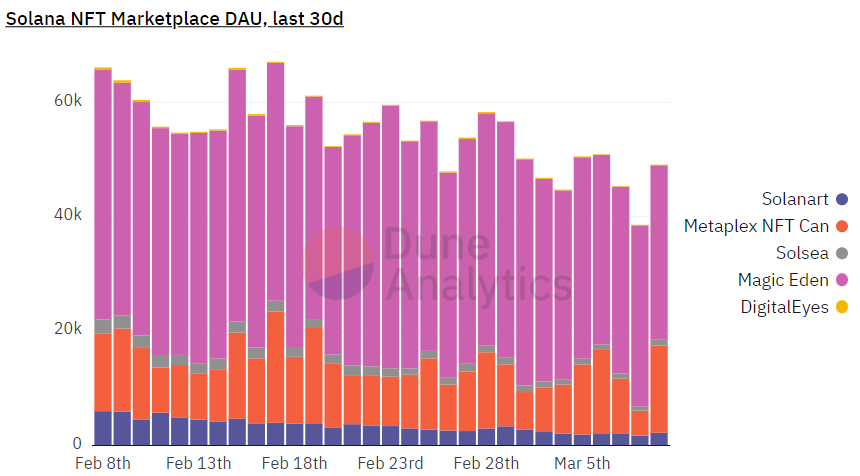
Daily active users peaked in mid-February at an impressive 247,000 - and fluctuated over the past month largely in the 150 - 200k range.
A significant portion of these users - often in the 40-50% range on a given day - are interacting with NFT protocols. Magic Eden dominates, but the market has some healthy competition and diversity:
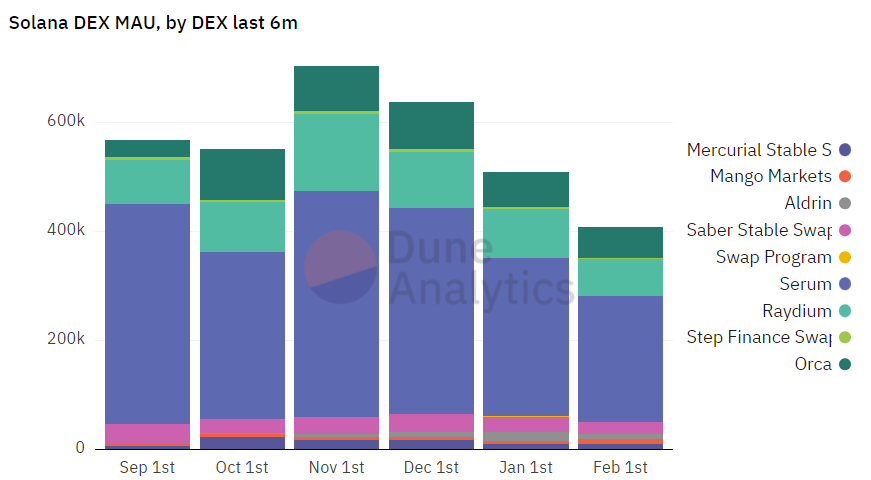
We see a similar environment in the DEX area. The leader is Serum, with Orca and Raydium also capturing significant market share.
This competitive environment seems to have changed little for the past 5 months, with the top three maintaining their relative share of users:
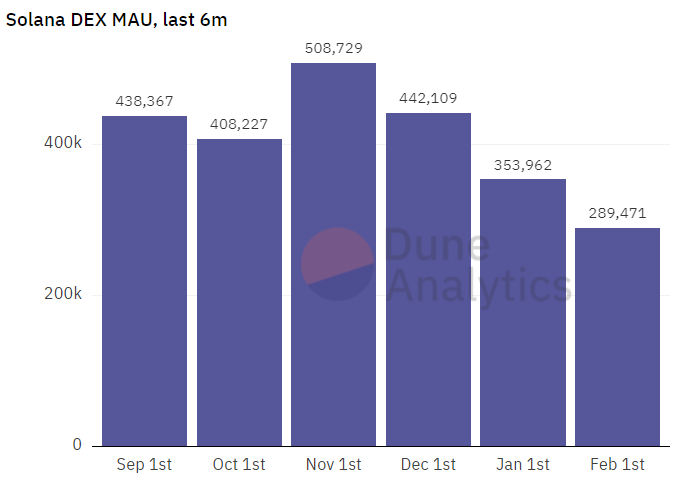
Total Solana DEX users have been dropping though since late 2021, hitting a high of more than 500k in November and shrinking to under 300k in February:
This will be a useful dashboard to bookmark to keep up with general Solana trends - check it out for more…..
You should also read this excellent Twitter breakdown by the creator:

Messari’s Dashboard of Dashboards
Messari are a crypto market intelligence organization with some excellent Dune Wizards working for them.
A few weeks back we interviewed Yulesa and Roberto from Messari on The Weekly Wizard where they got deep into DeFi reporting……. Check it out if you haven’t already!
This week they released a pretty awesome Dashboard of Dashboards, which combines some of their best work so far. It covers:
Compound
Uniswap on Ethereum, Optimism & Polygon
Livepeer
Sandbox
Airdrops
Flashloans
This is certainly one for the bookmarks to get an overview of what’s happening on some key protocols.
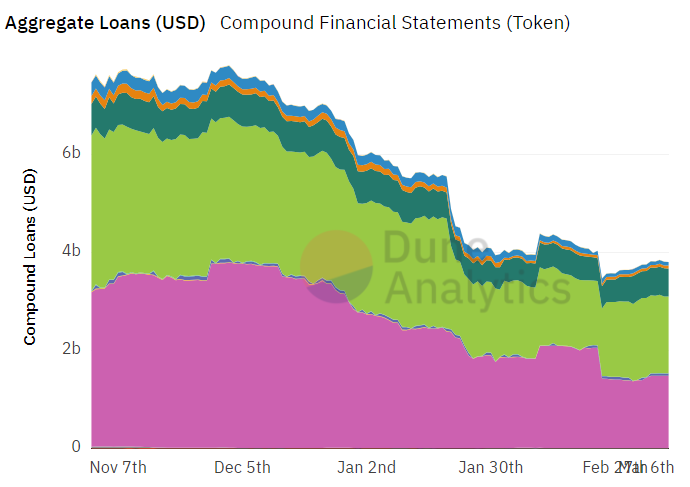
We can get a few interesting insights browsing through. For example, Compound total revenue has declined significantly since late 2021:
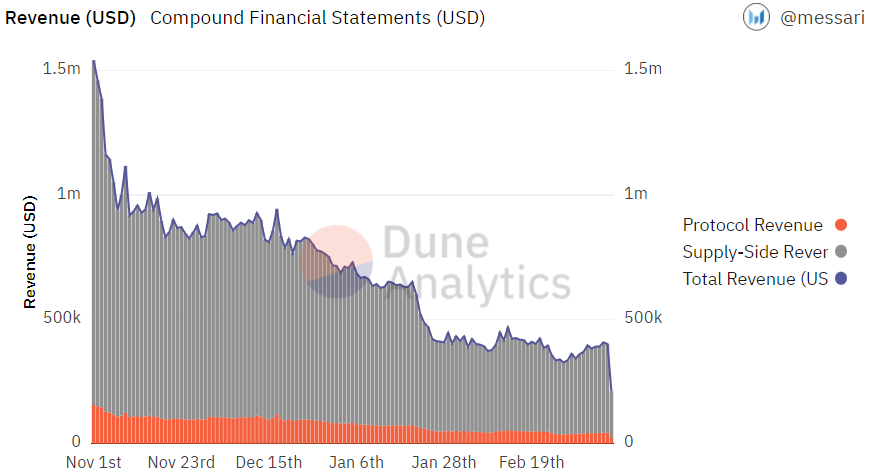
This correlates to a decline in aggregate loans:
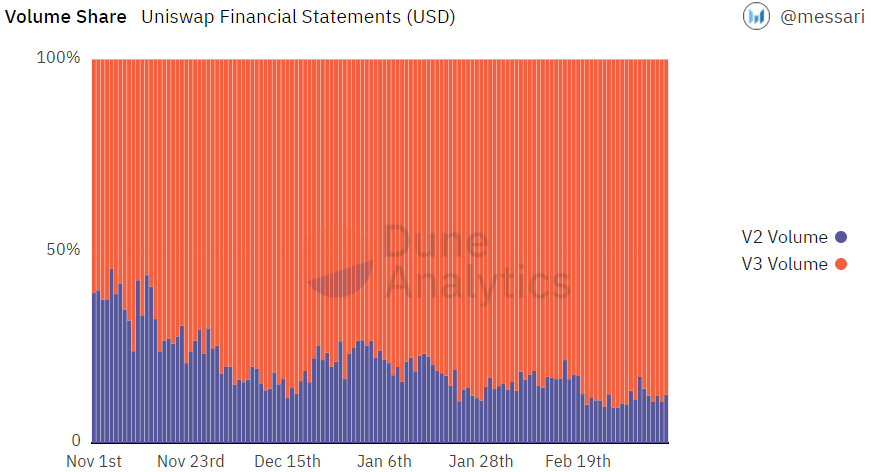
For Uniswap, the picture is a little different. It’s interesting to see the dynamic between V2 & V3 over the past 6 months. Since the 1st of November - aggregate V3 volume quickly outpaced V2:
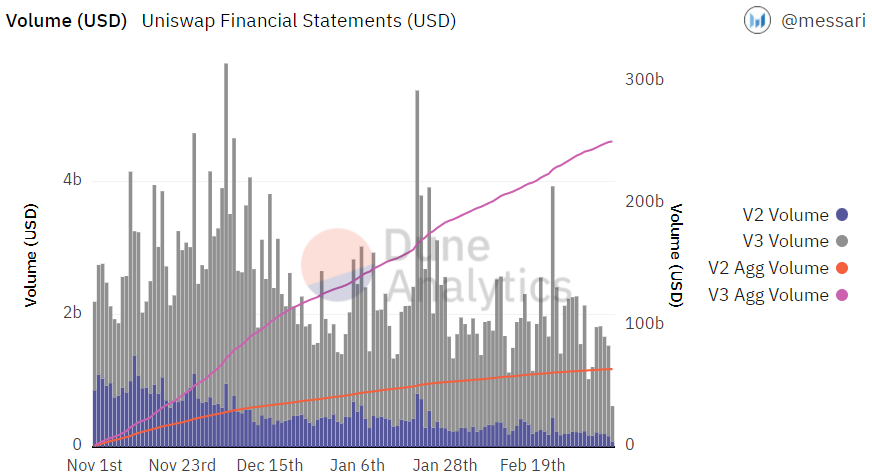
And now has become very dominant:
This dashboard is a real gem and well worth keeping an eye on - check it out for way more data!
DeGods
The Solana dashboards keep rolling in and it’s great to see. The first deep dive into a Solana NFT project came in this week - DeGods NFT & DAO Metrics by @osk2020.

Part of the DeGods ecosystem is the $DUST token, which users can get by burning any Solana NFT or by staking their DeGods. The team plans to launch a unique series of NFTs through 2022 that can be minted with $DUST.
Let’s take a look at the stats……..
Total sales volume is at an impressive 147,217 $SOL, which at current prices is more than $12 Million.
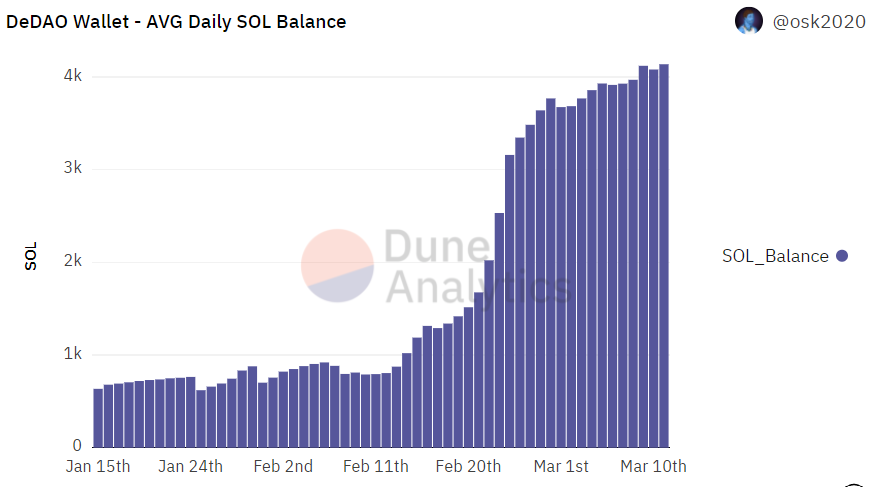
6.6% of NFT sales go into the DeDAO wallet, which currently has a balance of 4,159 $SOL after significant growth since late February:
You can read more about DeGods, and get a ton more stats in the dashboard - check it out!
NFT Project Tracker
What’s happening in the NFT market at the moment?
@sealaunch released a great dashboard this week that lets you track detailed stats of any Ethereum NFT project!
They explained this very cool dashboard in a thread:


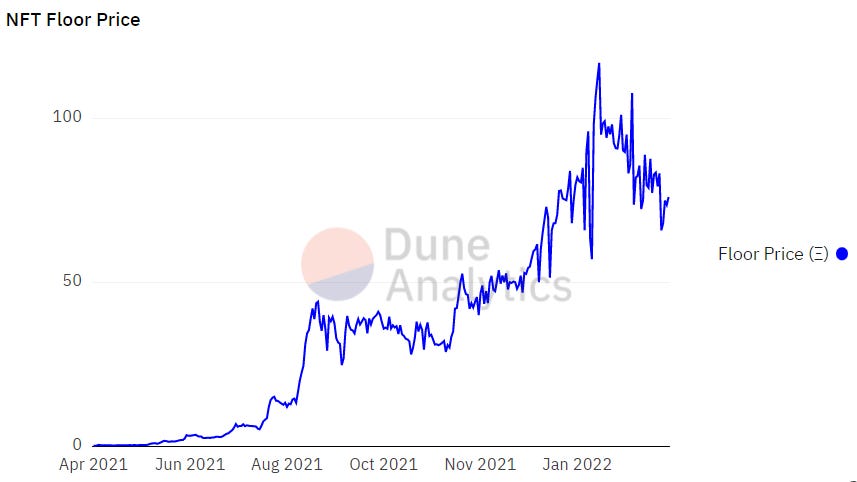
Let’s take BAYC as an example. We can see that the 24 hour volume is an intense 389.88 $ETH from 5 total sales.
Despite last year’s common predictions that floor prices on blue chip NFTs would soon crash - it seems to have held steady now sitting at 76 $ETH:
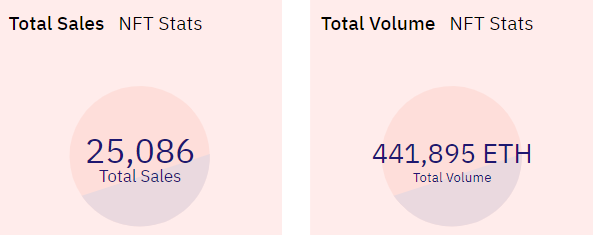
Total sales and volume are pretty crazy:
Take a look at this dashboard and investigate your favorite NFT projects!
$BANK
$BANK is the token for the Bankless DAO which grew out of the Bankless crypto media brand.
A dashboard came out this weed - $BANK Buy and Sell Volume by @paulapivat.
There’s a lot of activity around the token - with 6,860,849 sold over the past 7 days with a value of more than $200,000.
Trade volume since the middle of 2021 has been steady:
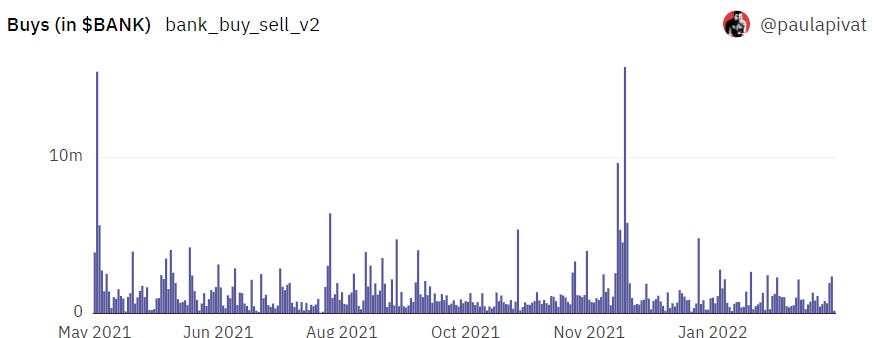
If you’re interested in $BANK and the Bankless DAO, this is a useful breakdown of the key activity.
Check out the full dashboard for more!
More Dashboards
GN
Thanks for reading - and thanks to all the awesome 🧙🧙🧙 for their work
We’ll see you again for more data and dashboards next week!
The data must flow………